Paradigm-dependent modulation of event-related fMRI activity evoked by the oddball task
- PMID: 11500995
- PMCID: PMC6871795
- DOI: 10.1002/hbm.1046
Paradigm-dependent modulation of event-related fMRI activity evoked by the oddball task
Abstract
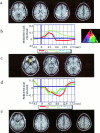
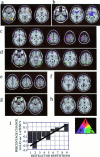
We have previously shown that event-related functional magnetic resonance imaging (ER-fMRI) may be used to record responses to the rapid, interleaved presentation of stimuli in the three-stimulus oddball task. The present study examined the sensitivity of ER-fMRI responses to variations in the range of inter-stimulus intervals (ISIs, calculated as the time from the offset of one stimulus to the onset of the next stimulus) and the type of behavioral response task used. ISIs were varied between a wide ISI range (550-2,050 msec) and a narrow ISI range (800-1,200 msec), while maintaining a similar mean ISI (approximately 1 stimulus per sec) between experiments. The response task was varied between button press and subvocal target counting. Gradient echo, echo planar images were acquired for each of three experiments (wide ISI with button press, narrow ISI with button press, and wide-ISI with counting) in five subjects. Target stimuli generated increased fMRI signal in a wide range of brain regions. The use of a narrow ISI range generated a greater volume of subcortical activity and a reduced volume of cortical activity relative to a wide ISI range. The counting task generated a larger amplitude and longer lasting evoked response in brain regions that responded during all three experiments. Rare distractor stimuli evoked fMRI signal change primarily in orbitofrontal, ventral-medial prefrontal and superior parietal cortex. These results illustrate that although ER-fMRI is relatively insensitive as a technique to small variations in the timing of stimulus-evoked responses, it is remarkably sensitive to consequences such variations have for the topographic location and amplitude of neural responses to stimuli.
Copyright 2001 Wiley-Liss, Inc.
Figures


Similar articles
-
Orthogonal polynomial regression for the detection of response variability in event-related fMRI.Neuroimage. 2002 Sep;17(1):344-63. doi: 10.1006/nimg.2002.1100. Neuroimage. 2002. PMID: 12482088 Clinical Trial.
-
Responses to rare visual target and distractor stimuli using event-related fMRI.J Neurophysiol. 2000 May;83(5):3133-9. doi: 10.1152/jn.2000.83.5.3133. J Neurophysiol. 2000. PMID: 10805707 Clinical Trial.
-
Neural networks of response shifting: influence of task speed and stimulus material.Brain Res. 2006 May 23;1090(1):146-55. doi: 10.1016/j.brainres.2006.03.039. Epub 2006 Apr 27. Brain Res. 2006. PMID: 16643867
-
Analysis of stimulus-induced brain dynamics during naturalistic paradigms.Neuroimage. 2020 Aug 1;216:116461. doi: 10.1016/j.neuroimage.2019.116461. Epub 2019 Dec 13. Neuroimage. 2020. PMID: 31843711 Free PMC article. Review.
-
Event-related fMRI in cognition.Neuroimage. 2012 Aug 15;62(2):1152-6. doi: 10.1016/j.neuroimage.2011.08.113. Epub 2011 Sep 22. Neuroimage. 2012. PMID: 21963919 Free PMC article. Review.
Cited by
-
Effect of the side of presentation in the visual field on phase-locked and nonphase-locked alpha and gamma responses.Sci Rep. 2022 Aug 1;12(1):13200. doi: 10.1038/s41598-022-15936-7. Sci Rep. 2022. PMID: 35915098 Free PMC article.
-
Anterior insula coordinates hierarchical processing of tactile mismatch responses.Neuroimage. 2016 Feb 15;127:34-43. doi: 10.1016/j.neuroimage.2015.11.030. Epub 2015 Nov 14. Neuroimage. 2016. PMID: 26584870 Free PMC article.
-
Human mesostriatal response tracks motivational tendencies under naturalistic goal conflict.Soc Cogn Affect Neurosci. 2016 Jun;11(6):961-72. doi: 10.1093/scan/nsw014. Epub 2016 Feb 1. Soc Cogn Affect Neurosci. 2016. PMID: 26833917 Free PMC article.
-
The hemodynamics of oddball processing during single-tone and two-tone target detection tasks.Int J Psychophysiol. 2006 Jun;60(3):292-303. doi: 10.1016/j.ijpsycho.2005.07.012. Epub 2005 Oct 5. Int J Psychophysiol. 2006. PMID: 16213043 Free PMC article.
-
The BOLD response and the gamma oscillations respond differently than evoked potentials: an interleaved EEG-fMRI study.BMC Neurosci. 2003 Sep 19;4:22. doi: 10.1186/1471-2202-4-22. BMC Neurosci. 2003. PMID: 14499000 Free PMC article.
References
-
- Bandettini PA, Cox RW (2000): Event‐related fMRI contrast when using constant inter‐stimulus interval: theory and experiment. Magn Reson Med 43: 540–548. - PubMed
-
- Baudena P, Halgren E, Heit G, Clarke JM (1995): Intracerebral potentials to rare target and distractor auditory and visual stimuli. III. Frontal cortex. Electroencephalogr Clin Neurophysiol 94: 251–264. - PubMed
-
- Burock MA, Buckner RL, Woldorff MG, Rosen BR, Dale AM (1998): Randomized event‐related experimental designs allow for extremely rapid presentation rates using functional MRI. Neuroreport 9: 3735–3739. - PubMed
-
- Clark VP, Fannon S, Lai S, Benson R, Bauer L (2000): Responses to rare visual target and distractor stimuli using event‐related fMRI. J Neurophysiol 83: 3133–3139. - PubMed
MeSH terms
LinkOut - more resources
Full Text Sources
Medical

