Comparative Study
. 2001 Aug 15;29(16):E83.
doi: 10.1093/nar/29.16.e83.

Optimal conditions to use Pfu exo(-) DNA polymerase for highly efficient ligation-mediated polymerase chain reaction protocols

Affiliations
Comparative Study

Optimal conditions to use Pfu exo(-) DNA polymerase for highly efficient ligation-mediated polymerase chain reaction protocols

M Angers et al. Nucleic Acids Res. .

Abstract

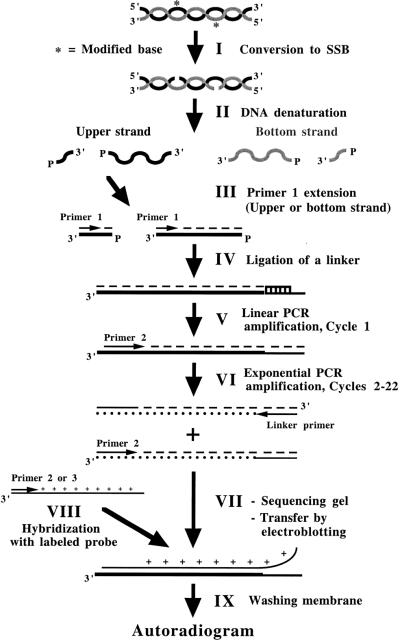
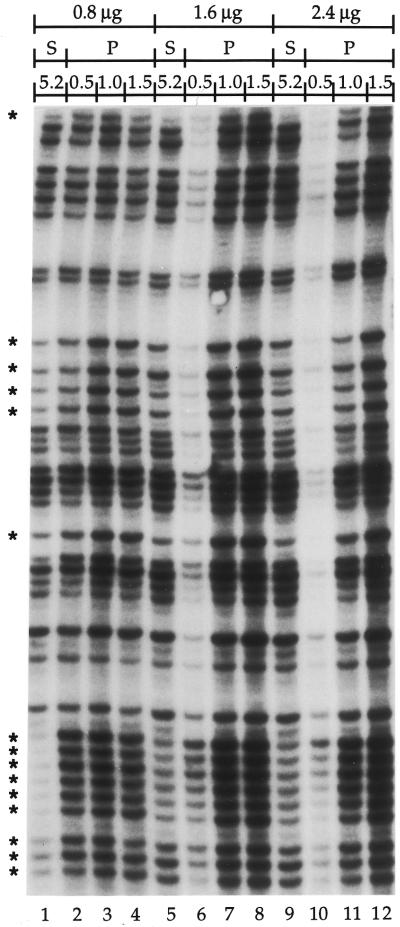
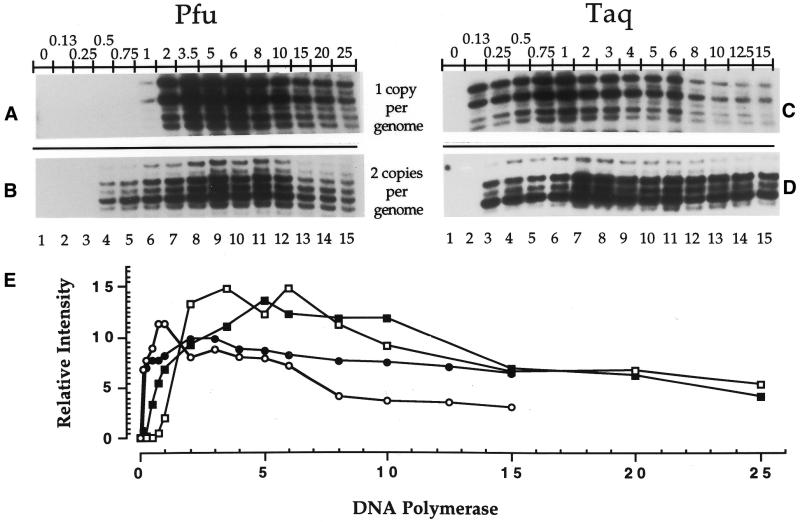
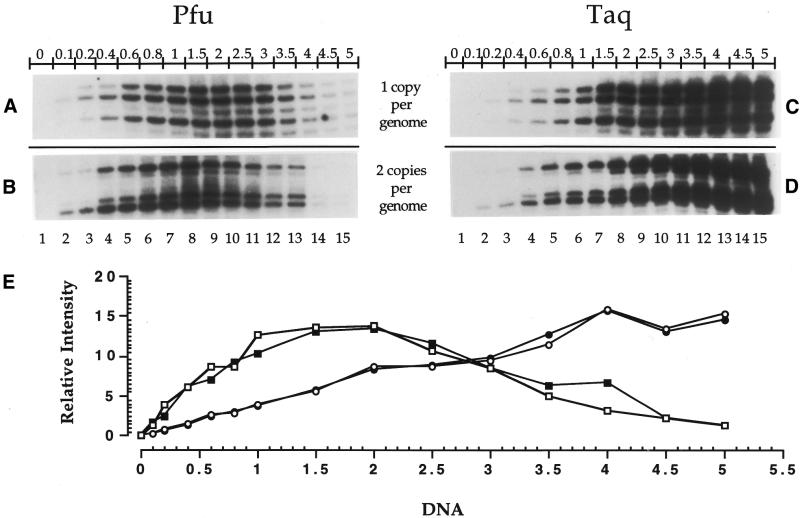
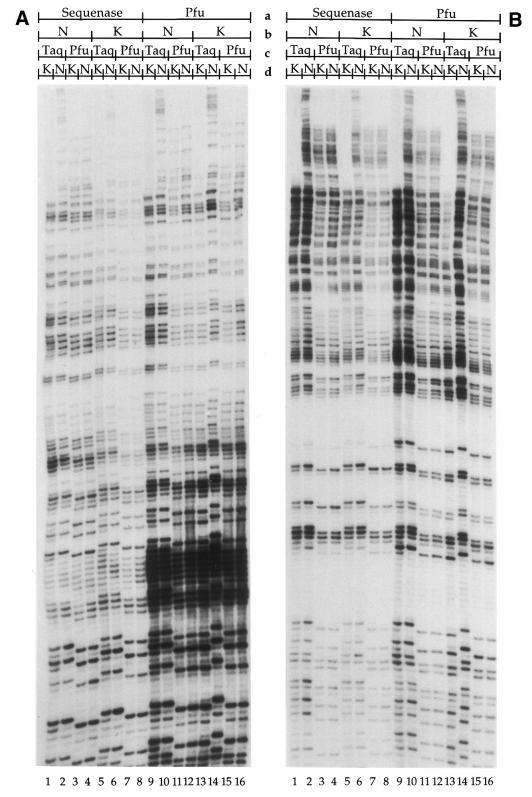
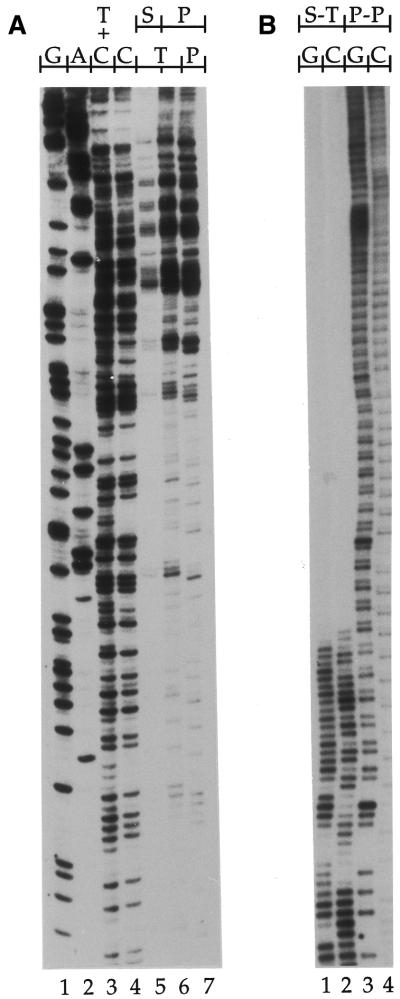
Ligation-Mediated Polymerase Chain Reaction (LMPCR) is the most sensitive sequencing technique available to map single-stranded DNA breaks at the nucleotide level of resolution using genomic DNA. LMPCR has been adapted to map DNA damage and reveal DNA-protein interactions inside living cells. However, the sequence context (GC content), the global break frequency and the current combination of DNA polymerases used in LMPCR affect the quality of the results. In this study, we developed and optimized an LMPCR protocol adapted for Pyrococcus furiosus exo(-) DNA polymerase (Pfu exo(-)). The relative efficiency of Pfu exo(-) was compared to T7-modified DNA polymerase (Sequenase 2.0) at the primer extension step and to Thermus aquaticus DNA polymerase (Taq) at the PCR amplification step of LMPCR. At all break frequencies tested, Pfu exo(-) proved to be more efficient than Sequenase 2.0. During both primer extension and PCR amplification steps, the ratio of DNA molecules per unit of DNA polymerase was the main determinant of the efficiency of Pfu exo(-), while the efficiency of Taq was less affected by this ratio. Substitution of NaCl for KCl in the PCR reaction buffer of Taq strikingly improved the efficiency of the DNA polymerase. Pfu exo(-) was clearly more efficient than Taq to specifically amplify extremely GC-rich genomic DNA sequences. Our results show that a combination of Pfu exo(-) at the primer extension step and Taq at the PCR amplification step is ideal for in vivo DNA analysis and DNA damage mapping using LMPCR.


Figures

Figure 1
Figure 1
Overview of the different steps in the LMPCR protocol.
Figure 2
Figure 2
Comparison of the efficiency of Sequenase 2.0 and Pfu exo with different amounts of DNA at the primer extension step of LMPCR. This autoradiogram shows a representative sequence that was produced using primer set X (primers X1, X2 and X3) from the FMR1 gene promoter. Every PCR amplification step was done using 3 U of Taq. LMPCR was performed on increasing quantities of purified genomic DNA treated with standard Maxam–Gilbert guanine cleavage reaction (global SSB frequency: 1 break/400 bases); 0.8, 1.6 and 2.4 µg of DNA was used (lanes 1–4, 5–8 and 9–12, respectively). Lanes 1, 5 and 9 show LMPCR protocols done using 5.2 U of Sequenase 2.0 (S) at the primer extension step; lanes 2–4, 6–8 and 10–12 show LMPCR protocols done using 0.5 (lanes 2, 6 and 10), 1.0 (lanes 3, 7 and 11) or 1.5 U (lanes 4, 8 and 12) of Pfu exo (P) at the primer extension step. An asterisk indicates a band in the Sequenase 2.0 track that shows an intensity markedly different compared to the rest of the bands in the track.
Figure 3
Figure 3
Comparison of PCR amplification efficiency using different amounts of either Taq or Pfu exo at the PCR amplification step. Sequenase 2.0 was used for each primer extension step and 1 µg of purified genomic DNA treated with standard Maxam–Gilbert guanine cleavage reaction (global SSB frequency: 1 break/400 bases) was used. Each of the four protocols was repeated twice. All the stripes shown are representative samples from the analyzed autoradiograms. (A) The short representative sequence shown was analyzed using primer set A (primers A1, A2 and A3) selected from the PGK1 gene promoter (one copy per genome). For (A) and (B), the amount of Pfu exo varied from 0–25 U (lanes 1–15). (B) The short representative sequence shown was analyzed using primer set MH (primers MH1 and MH2) selected from the COX2 gene promoter (two copies per genome). (C) The short representative sequence shown was analyzed using primer set A (primers A1, A2 and A3) selected from the PGK1 gene promoter. For (C) and (D), the amount of Taq varied from 0–15 U (lanes 1–15). (D) The short representative sequence shown was analyzed using primer set MH (primers MH1 and MH2) selected from the COX2 gene promoter. (E) Graph showing the effects of different amounts of Pfu exo and Taq from (A) (open square), (B) (filled square), (C) (open circle) and (D) (filled circle) on genomic DNA. The calculated value at each point represents the relative intensity of the corresponding band against the total intensity value obtained by the addition of the intensity from every band of a lane from an autoradiogram.
Figure 4
Figure 4
Comparison of PCR amplification efficiency using different amounts of purified genomic DNA. Sequenase 2.0 was used at every primer extension step and purified genomic DNA treated with standard Maxam–Gilbert guanine cleavage reaction (global SSB frequency: 1 break/400 bases). Each of the four protocols was repeated twice. All the stripes shown are representative samples from the analyzed autoradiograms. The initial amount of DNA varied from 0–5 µg (lanes 1–15). (A) The short representative sequence shown was analyzed using primer set A (primers A1, A2 and A3) selected from the PGK1 gene promoter (one copy per genome). In (A) and (B), 3.5 U of Pfu exo were used at the PCR amplification step. (B) The short representative sequence shown was analyzed using primer set MH (primers MH1 and MH2) selected from the COX2 gene promoter (two copies per genome). (C) The short representative sequence shown was analyzed using primer set A (primers A1, A2 and A3) selected from the PGK1 gene promoter. In (C) and (D), 3 U of Taq were used at the PCR amplification step. (D) The short representative sequence shown was analyzed using primer set MH (primers MH1 and MH2) selected from the COX2 gene promoter. (E) Graph showing the effects of different amounts of genomic DNA on the polymerization efficiency of Pfu exo and Taq from (A) (open square), (B) (filled square), (C) (open circle) and (D) (filled circle). The calculated value at each point represents the relative intensity of the corresponding band against the total intensity value obtained by the addition of the intensity from every band of a lane from an autoradiogram.
Figure 5
Figure 5
Comparison of the effects of KCl and NaCl on band intensities at primer extension and PCR amplification steps of LMPCR. The region shown was analyzed using primer set X (primers X1, X2 and X3) selected from the FMR1 gene promoter. The starting amount of DNA was 1 µg with a SSB frequency of 1 break/400 bases. (A) Purified genomic DNA was treated with standard Maxam–Gilbert guanine cleavage reaction and processed by LMPCR. In lanes 1–4, Sequenase 2.0 was used with NaCl in the DNA polymerase buffer (Sequenase 2.0/NaCl) at the primer extension step with Taq/KCl (lane 1), Taq/NaCl (lane 2), Pfu exo/KCl (lane 3) and Pfu exo/NaCl (lane 4) at the PCR amplification step. In lanes 5–8, Sequenase 2.0/KCl was used at the primer extension step with Taq/KCl (lane 5), Taq/NaCl (lane 6), Pfu exo/KCl (lane 7) and Pfu exo/NaCl (lane 8) at the PCR amplification step. In lanes 9–12, Pfu exo/NaCl was used at the primer extension step with Taq/KCl (lane 9), Taq/NaCl (lane 10), Pfu exo/KCl (lane 11) and Pfu exo/NaCl (lane 12) at the PCR amplification step. In lanes 13–16, Pfu exo/KCl was used at the primer extension step with Taq/KCl (lane 13), Taq/NaCl (lane 14), Pfu exo/KCl (lane 15) and Pfu exo/NaCl (lane 16) at the PCR amplification step. (B) Purified genomic DNA was treated with standard Maxam–Gilbert pyrimidine (T+C) cleavage reaction. Lanes 1–16 are as described in (A). a, DNA polymerase at primer extension step; b, cation at primer extension step; c, DNA polymerase at PCR amplification step; d, cation at PCR amplification step.
Figure 6
Figure 6
Efficiency of Pfu exo on low break frequency DNA and extremely GC-rich DNA in LMPCR. (A) LMPCR of purified genomic DNA with a low global SSB frequency (1 break/5 kb) produced by irradiation with 30 Jm–2 UVC (254 nm). The sequence shown was analyzed using primer set A (primers A1, A2 and A3) selected from the PGK1 gene promoter. The starting amount of DNA was 1 µg. Lanes 1–4, LMPCR of purified genomic DNA treated with standard Maxam–Gilbert cleavage reactions with Pfu exo used for both primer extension and PCR amplification steps; lane 5, LMPCR of purified DNA treated with 254-nm UV using Sequenase 2.0 at the primer extension step and Taq at the PCR amplification step; lane 6, LMPCR of purified DNA treated with UVC using Sequenase 2.0 at the primer extension step and Pfu exo at the PCR amplification step; lane 7, LMPCR of purified DNA treated with UVC using Pfu exo at both primer extension and PCR amplification steps. (B) LMPCR of purified genomic DNA with a high global SSB frequency (1 break/400 bp) on the CGG triplet repeat of the FMR1 gene. The sequence shown was analyzed using primer set U (primers U1, U2 and U3) selected from the FMR1 gene promoter. The starting amount of DNA was 1 µg. Purified genomic DNA from a normal male who has a FMR1 gene with a haplotype of 33 CGG triplet repeats (∼100% GC-rich) was treated with standard Maxam–Gilbert guanine or cytosine cleavage reaction. Lanes 1–2, LMPCR using Sequenase 2.0 at the primer extension step and Taq at the PCR amplification step (lane 1, guanine; lane 2 cytosine). Lanes 3–4, LMPCR using Pfu exo at both primer extension and PCR amplification steps (lane 3, guanine; lane 4 cytosine).

References

    1. Pfeifer G.P., Singer-Sam,J. and Riggs,A.D. (1993) Analysis of methylation and chromatin structure. Methods Enzymol., 225, 567–583. - PubMed
    1. Cartwright I.L. and Kelly,S.E. (1991) Probing the nature of chromosomal DNA–protein contacts by in vivo footprinting. Biotechniques, 11, 188–196. - PubMed
    1. Mueller P.R. and Wold,B. (1989) In vivo footprinting of a muscle specific enhancer by ligation mediated PCR. Science, 246, 780–786. [Published erratum appears in Science (1990) 248, 802] - PubMed
    1. Pfeifer G.P., Steigerwald,S.D., Mueller,P.R., Wold,B. and Riggs,A.D. (1989) Genomic sequencing and methylation analysis by ligation mediated PCR. Science, 246, 810–813. - PubMed
    1. Pfeifer G.P., Tanguay,R.L., Steigerwald,S.D. and Riggs,A.D. (1990) In vivo footprint and methylation analysis by PCR-aided genomic sequencing: comparison of active and inactive X chromosomal DNA at the CpG island and promoter of human PGK-1. Genes Dev., 4, 1277–1287. - PubMed

Publication types

MeSH terms