. 2001 Aug 28;98(18):10160-5.
doi: 10.1073/pnas.181354198. Epub 2001 Aug 14.

Self-organization of a radial microtubule array by dynein-dependent nucleation of microtubules

Affiliations

Self-organization of a radial microtubule array by dynein-dependent nucleation of microtubules

I Vorobjev et al. Proc Natl Acad Sci U S A. .

Abstract

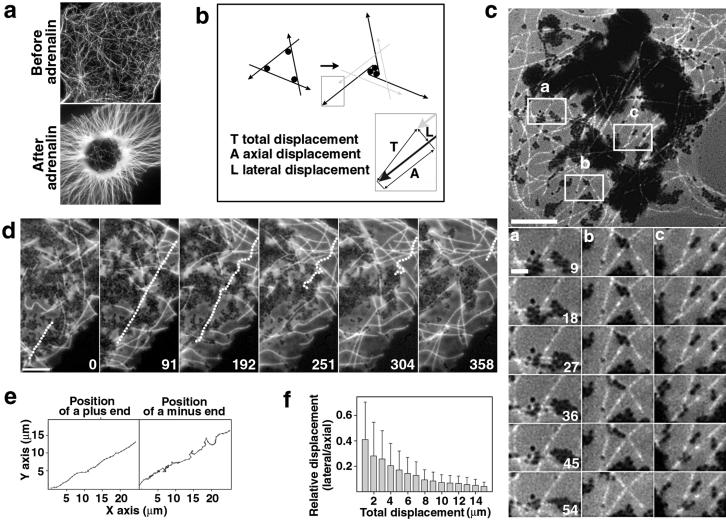
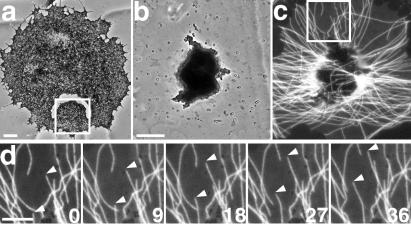
Polarized radial arrays of cytoplasmic microtubules (MTs) with minus ends clustered at the cell center define the organization of the cytoplasm through interaction with microtubule motors bound to membrane organelles or chromosomes. It is generally assumed that the radial organization results from nucleation of MTs at the centrosome. However, radial MT array can also be attained through self-organization that requires the activity of a minus-end-directed MT motor, cytoplasmic dynein. In this study we examine the role of cytoplasmic dynein in the self-organization of a radial MT array in cytoplasmic fragments of fish melanophores lacking the centrosome. After activation of dynein motors bound to membrane-bound organelles, pigment granules, the fragments rapidly form polarized radial arrays of MTs and position pigment aggregates at their centers. We show that rearrangement of MTs in the cytoplasm is achieved through dynein-dependent MT nucleation. The radial pattern is generated by continuous disassembly and reassembly of MTs and concurrent minus-end-directed transport of pigment granules bearing the nucleation sites.


Figures

Figure 1
Figure 1
Organization of a polarized radial array does not involve MT transport. (a) Live fluorescence images of MTs in a fragment before and after stimulation with adrenaline. (b) A model proposed to describe the organization of a radial array through the transport of MTs (black thick lines; arrows indicate plus ends) by multivalent minus-end-directed MT motors (black circles). Gray lines indicate the initial position of MTs. The diagram at the bottom illustrates the direction of movement of a MT end during the formation of a radial array through a transport mechanism. The attainment of a radial organization depends on the axial and lateral displacement of MT ends. (c) Behavior of fluorescent speckles produced by injection of melanophores with fluorescently tagged tubulin subunits at a low (0.5 mg/ml) concentration. (Upper) MTs with speckles at low magnification. (Lower) Time sequences of speckles on MTs in the regions indicated in the upper panel. Numbers indicate the time in seconds for all three time sequences [scale bars, 10 μm (Upper) and 2 μm (Lower)]. (d and e) Fishtailing of a MT in a fragment stimulated with adrenaline. (d) Time sequence. Contours of a fishtailing MT are shown as a dotted line. The plus end is at the top and the minus end is at the bottom. The time in seconds is indicated at the lower right corner of each panel (scale bar, 5 μm). (e) Life histories of a plus end (Left) and a minus end (Right) of a MT shown in d. (f) Processivity of the lateral displacement of the minus ends of fishtailing MTs. The ratio of lateral to axial displacement of a MT minus end (shift at right angles to a MT axis vs. shift along the axis) was plotted against the total displacement (total distance covered by an end) at increasing time intervals (for the definition of total, axial, and lateral displacement see also bottom part of b).
Figure 2
Figure 2
Pigment aggregates are capable of MT nucleation. (a) Live images of MTs during recovery after cold treatment. Numbers in the lower right corner of each panel indicate the time in minutes and seconds after transfer of a chilled fragment to room temperature (scale bar, 10 μm). (b) MTs in a fragment before and after pigment aggregation. (Upper) Live images of MTs (scale bar, 5 μm). (Lower) Change in MT length after aggregation. (c) The ratio of MT densities before and after stimulation with adrenaline in control (left bar) or pigment-free (right bar) fragments. MT densities were determined by measuring the total MT length in the same fragments before and 20 min after stimulation with adrenaline.
Figure 3
Figure 3
Dynein inhibitors disorganize radial MT arrays in the fragments. (a) Immunoblot of the extract of black tetra melanophores with antibody against the intermediate chain of cytoplasmic dynein (antibody 74.1). (b) Live images of MTs after injection of antibody 74.1 (3.3 mg/ml needle). Numbers in the lower right corner indicate the time in minutes after injection (scale bar, 5 μm). (c) Kinetics of the decrease in the level of MT polymer after injection of 74.1 antibody. The level of MT polymer at each time point was calculated as the difference between mean fluorescence intensities in a region containing and a region lacking MT. (d) Effect of injecting dynein inhibitors on the level of MT polymer. Error bars indicate the 99% confidence interval. MT polymer level was determined by single-cell fluorescence ratiometric assay. Pigment-free fragments were dissected from cells with aggregated pigment granules. Needle concentrations of nonimmune mouse IgG, dynein antibody 74.1 (14), and recombinant subunit of dynactin (p50, dynamitin) were 3.5, 3.3, and 15 mg/ml respectively.
Figure 4
Figure 4
Outgrowth of microtubules from a local pigment aggregate formed on the noncentrosomal side of a wound in a whole melanophore. (a) Phase-contrast image of a melanophore with dispersed pigment with a U-shaped wound produced with a glass microneedle. (b) Magnified phase-contrast image of a region outlined in a 10 min after induction of aggregation with adrenaline. The pigment aggregate has been formed on the noncentrosomal side of the wound. (c and d) Live fluorescence images of microtubules that surround the pigment aggregate shown in b. (c) Distribution of microtubules around the pigment aggregate. (d) Time sequence of microtubules at a high magnification in the boxed region shown in c. MTs continuously emerged from the pigment aggregate and grew to the wound or to the cell margin by the addition of subunits to the plus ends (indicated by arrowheads). Numbers indicate the time in seconds [scale bars, 20 μm (a), 10 μm (b and c), and 5 μm (d)].
Figure 5
Figure 5
A model for the formation of a radial MT array in melanophore fragments. (a) In the dispersed state, pigment granules and microtubules are distributed randomly in a fragment. (b) After stimulation with adrenaline, transport of pigment granules to the MT minus ends results in the formation of local pigment aggregates. (c) Nucleation of MTs on the pigment aggregates produces microasters. (d) Fusion of microasters results in the formation of a single radial array of microtubules with the pigment aggregate at the center.

References

    1. Kellog D R, Moritz M, Alberts B. Annu Rev Biochem. 1994;63:639–674. - PubMed
    1. Mitchison T J, Kirschner M A. Nature (London) 1984;312:237–242. - PubMed
    1. Lane J, Allan V. Biochim Biophys Acta. 1998;1376:27–55. - PubMed
    1. Goldstein L S, Philp A V. Annu Rev Cell Dev Biol. 1999;15:141–183. - PubMed
    1. Holzbaur E, Vallee R B. Annu Rev Cell Biol. 1994;10:331–372. - PubMed

Publication types

LinkOut - more resources