. 2001 Sep;21(18):6233-42.
doi: 10.1128/MCB.21.18.6233-6242.2001.

Targeting of the c-Abl tyrosine kinase to mitochondria in endoplasmic reticulum stress-induced apoptosis

Affiliations

Targeting of the c-Abl tyrosine kinase to mitochondria in endoplasmic reticulum stress-induced apoptosis

Y Ito et al. Mol Cell Biol. 2001 Sep.

Abstract

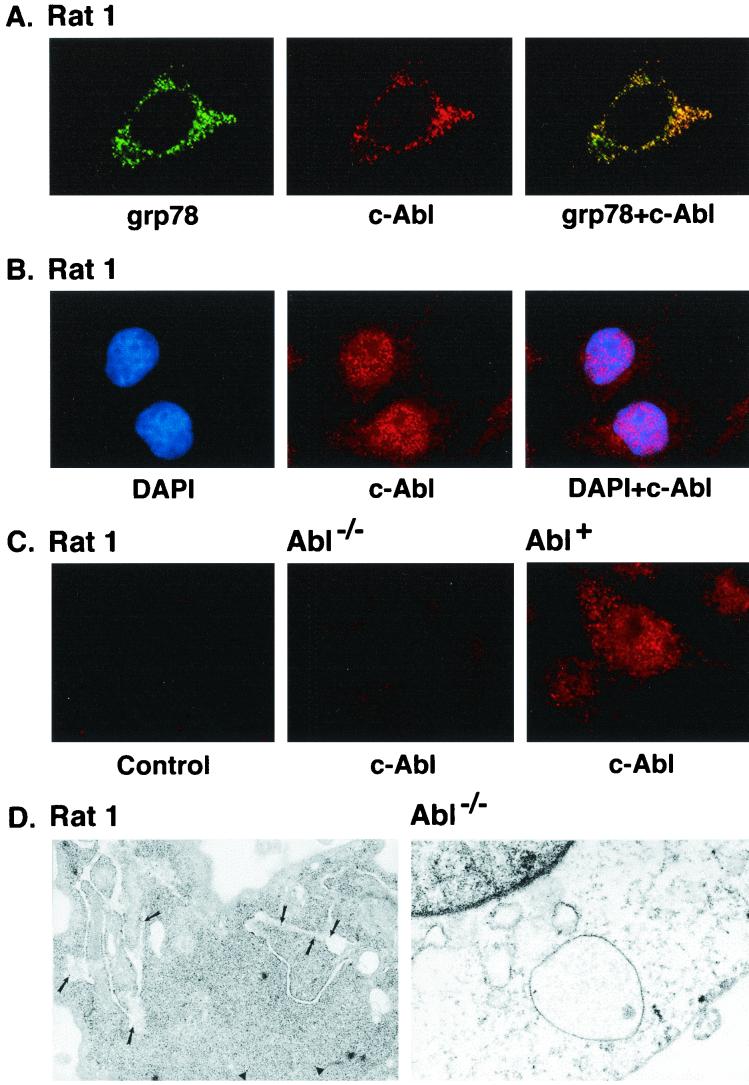
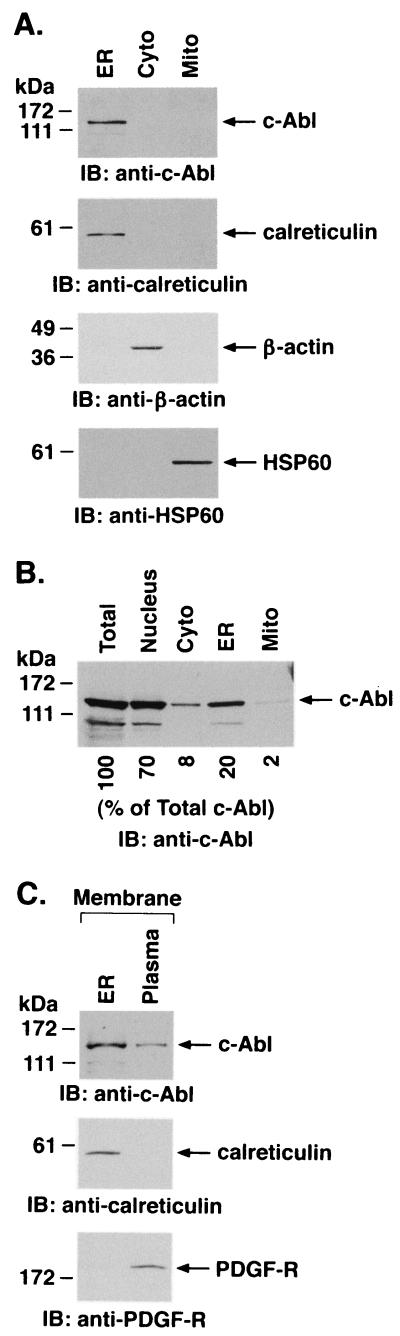
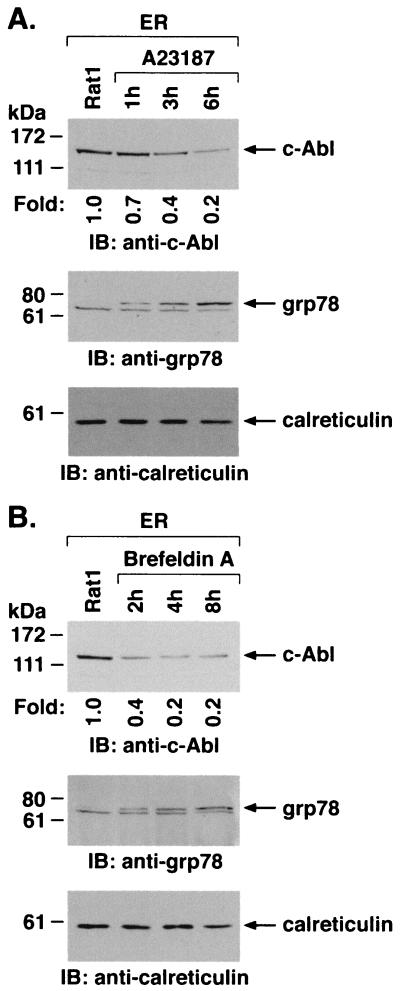
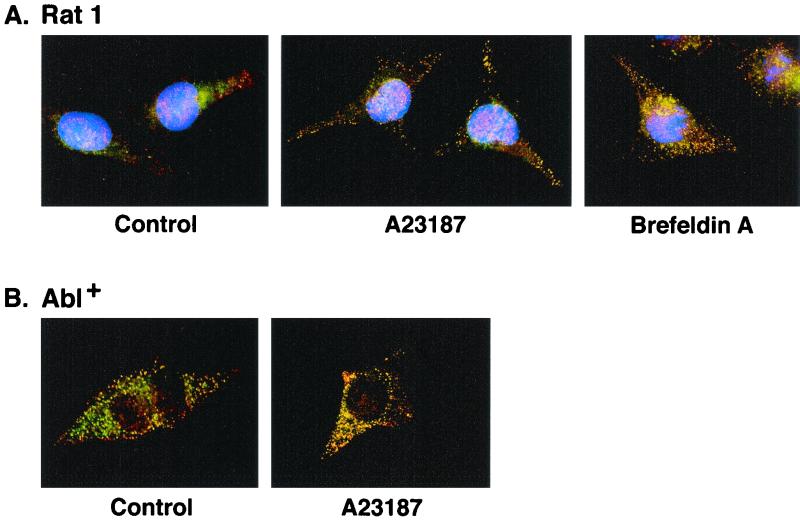
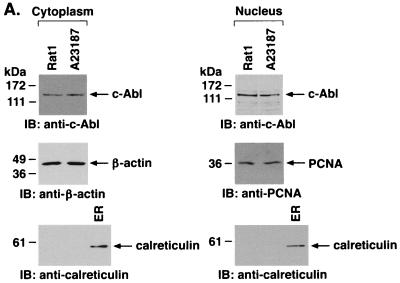
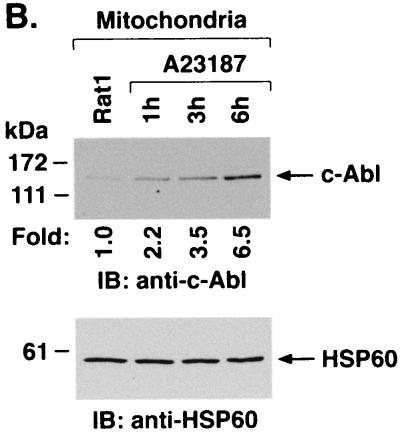
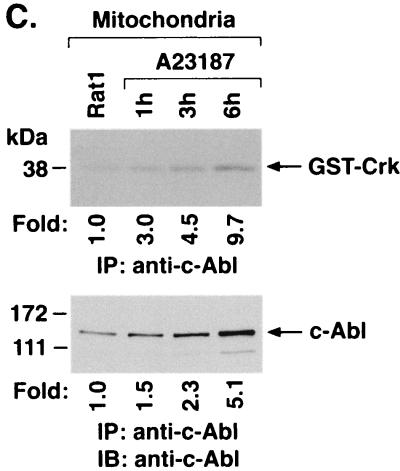
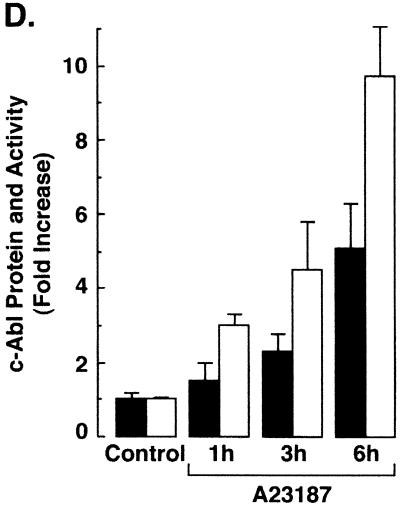
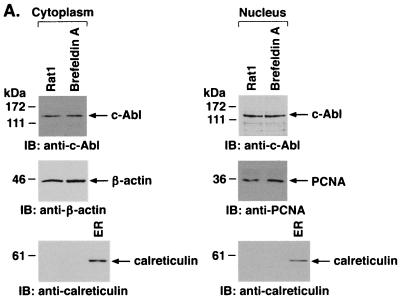
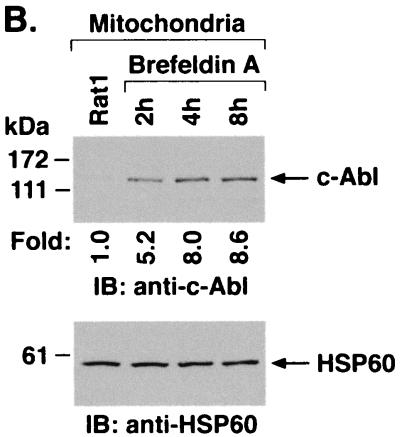
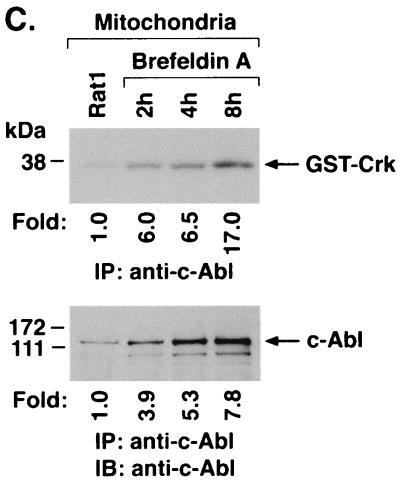
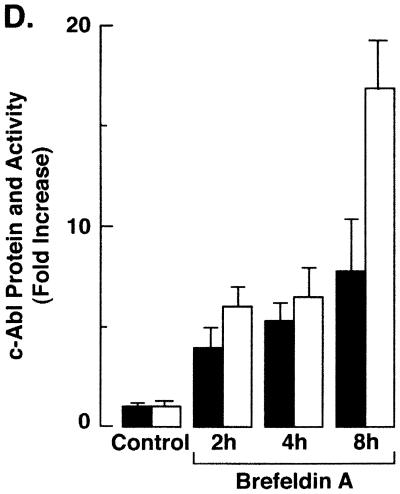
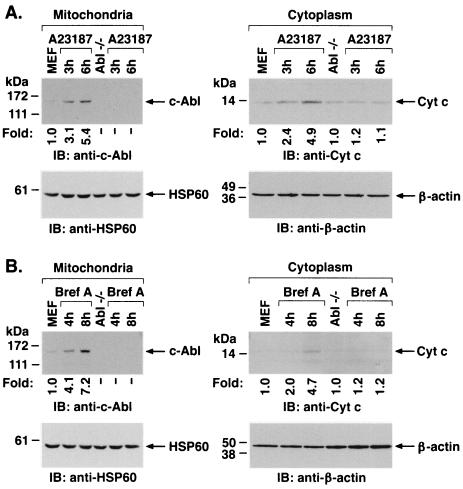
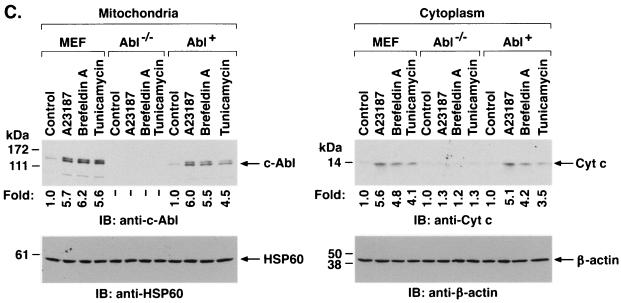
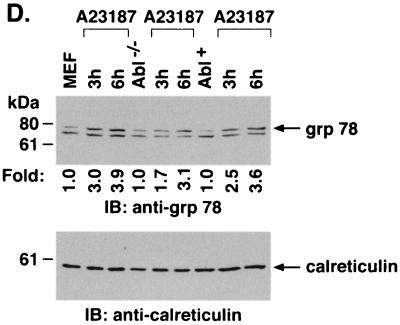
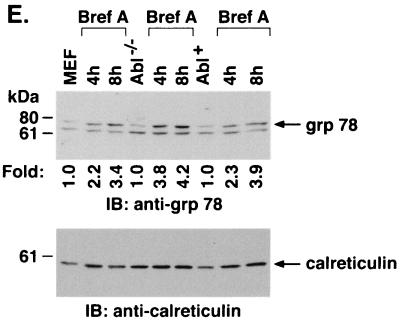
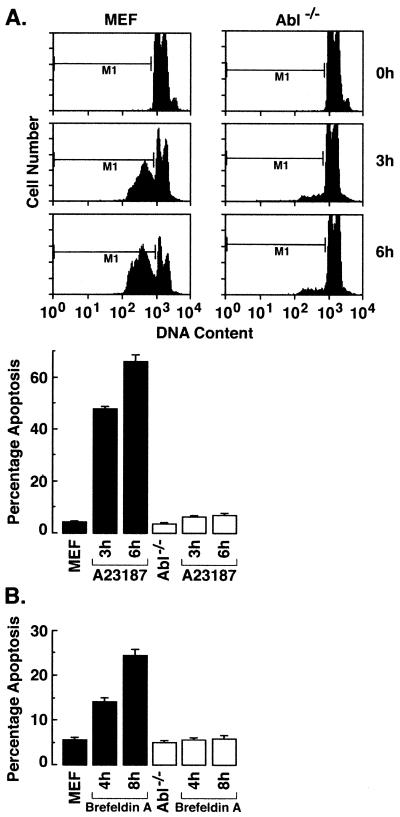
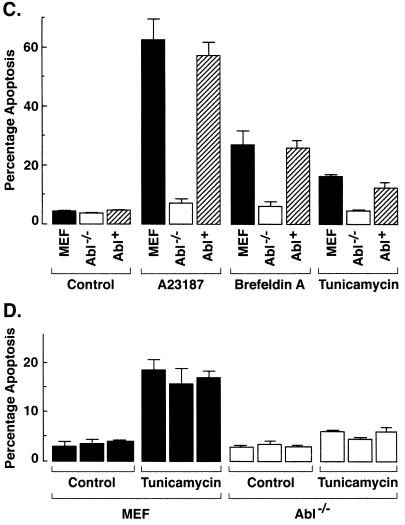
The ubiquitously expressed c-Abl tyrosine kinase localizes to the nucleus and cytoplasm. Using confocal microscopy, we demonstrated that c-Abl colocalizes with the endoplasmic reticulum (ER)-associated protein grp78. Expression of c-Abl in the ER was confirmed by immunoelectron microscopy. Subcellular fractionation studies further indicate that over 20% of cellular c-Abl is detectable in the ER. The results also demonstrate that induction of ER stress with calcium ionophore A23187, brefeldin A, or tunicamycin is associated with translocation of ER-associated c-Abl to mitochondria. In concert with targeting of c-Abl to mitochondria, cytochrome c is released in the response to ER stress by a c-Abl-dependent mechanism, and ER stress-induced apoptosis is attenuated in c-Abl-deficient cells. These findings indicate that c-Abl is involved in signaling from the ER to mitochondria and thereby the apoptotic response to ER stress.


Figures

FIG. 1
FIG. 1
(A) Colocalization of c-Abl and ER-associated proteins. Rat1 cells grown on poly-d-lysine-coated coverslips were fixed, permeabilized, and blocked in medium containing serum. Rat1 cells were subjected to immunofluorescence staining with goat anti-grp78 antibody and rabbit anti-c-Abl. The green signals for grp78 were obtained with fluorescein isothiocyanate-conjugated donkey anti-goat IgG (left). The red signal (c-Abl) was obtained with CY-3-conjugated donkey anti-rabbit IgG secondary antibody (middle). Overlay resulted in yellow signals indicative of colocalization (right). The digital confocal image was set for the ER. (B) Rat1 cells were incubated with DAPI (left, blue signal) and rabbit anti-c-Abl. The red signal for c-Abl was obtained with the CY-3-conjugated donkey anti-rabbit IgG (middle). The overlay demonstrates localization of c-Abl in the nucleus (right). The confocal image was set for the nucleus. (C) Rat1 cells were incubated with CY-3-conjugated donkey anti-rabbit IgG (no anti-c-Abl; left). Abl−/− (middle) and Abl+ (right) cells were incubated with anti-c-Abl and CY-3-conjugated donkey anti-rabbit IgG. The confocal image was set for the nucleus and cytoplasm. (D) Rat1 (left) and Abl−/− (right) cells were subjected to immunogold labeling with anti-c-Abl. Gold particles were counted in nine Rat1 cells. The average number of gold particles per cell was 29 ± 14 (mean ± standard deviation). The percentages of total particles in the following subcellular fractions were 57% ± 14% (nucleus), 12% ± 8% (ER), 2% ± 4% (mitochondria), and 29% ± 9% (cytoplasm). Magnification, ×30,000.
FIG. 2
FIG. 2
Subcellular distribution of c-Abl. (A) ER, cytoplasmic (Cyto), and mitochondrial (Mito) fractions were isolated from Rat1 cells. Equal amounts of protein (5 μg) from each fraction were subjected to immunoblotting (IB) with anti-c-Abl, anticalreticulin, anti-β-actin, or anti-HSP60. (B) Rat1 cells (2 × 10⁷) were divided into five aliquots for preparation of total cell, nuclear, cytoplasmic, ER, and mitochondrial lysates. The lysates were adjusted to 500 μl with PBS, and aliquots (20 μl) were subjected to immunoblotting with anti-c-Abl. Signal intensities were analyzed by densitometric scanning. The results are presented as the percentage of c-Abl in each subcellular fraction compared to that in the total cell lysate. (C) ER and plasma membrane preparations were isolated from Rat1 cells. Equal amounts of protein (5 μg) were subjected to immunoblot analysis with anti-c-Abl, anticalreticulin, and anti-PDGF-R.
FIG. 3
FIG. 3
ER stress decreases ER-associated c-Abl. Rat1 cells were treated with 10 μM A23187 (A) or 10 μg of brefeldin A per ml (B) and harvested at the indicated times. ER fractions were isolated and subjected to immunoblotting with anti-c-Abl (upper panels), anti-grp78 (middle panels), or anticalreticulin (lower panels). The signal intensities of c-Abl protein were compared to that of the control.
FIG. 4
FIG. 4
ER stress targets c-Abl to mitochondria. (A) Rat1 cells (left) were treated with 10 μM A23187 for 6 h (middle) or 10 μg of brefeldin A per ml for 8 h (right). (B) Abl+ cells (left) were treated with 10 μM A23187 for 6 h (right). After being washed, the cells were immobilized on slides, fixed, and incubated with anti-c-Abl antibody followed by Texas red-conjugated goat anti-rabbit IgG. Rat1 cells were also stained with DAPI, while no DAPI was used for staining of the Abl+ cells. Mitochondria were stained with the mitochondrion-selective dye Mitotracker green. The slides were visualized using a fluorescence microscope coupled to a high-sensitivity charge-coupled device camera and image analyzer. Red signal, c-Abl; green signal, Mitotracker; yellow-orange signals, colocalization of c-Abl and Mitotracker.
FIG. 5
FIG. 5
A23187 induces mitochondrial translocation of c-Abl. (A) Rat1 cells were treated with 10 μM A23187 and harvested at 6 h. Cytoplasmic and nuclear fractions were isolated and subjected to immunoblotting (IB) with anti-c-Abl, anti-β-actin, anti-PCNA, or anticalreticulin. (B) Rat1 cells were treated with 10 μM A23187 and harvested at the indicated times. Mitochondrial fractions were isolated and subjected to immunoblotting with anti-c-Abl or anti-HSP60. The signal intensities of c-Abl protein were compared to that of the control. (C) Rat1 cells were treated with 10 μM A23187 and harvested at the indicated times. Mitochondrial fractions were subjected to immunoprecipitation (IP) with anti-c-Abl. The precipitates were analyzed in a c-Abl kinase assay using GST-Crk(120–225) as the substrate or subjected to immunoblotting with anti-c-Abl. The signal intensities of c-Abl activity and protein were compared to that of the controls. (D) The increases in mitochondrial c-Abl protein (solid bars) and activity (open bars) are expressed as the means plus standard deviations obtained from three separate experiments.
FIG. 5
FIG. 5
A23187 induces mitochondrial translocation of c-Abl. (A) Rat1 cells were treated with 10 μM A23187 and harvested at 6 h. Cytoplasmic and nuclear fractions were isolated and subjected to immunoblotting (IB) with anti-c-Abl, anti-β-actin, anti-PCNA, or anticalreticulin. (B) Rat1 cells were treated with 10 μM A23187 and harvested at the indicated times. Mitochondrial fractions were isolated and subjected to immunoblotting with anti-c-Abl or anti-HSP60. The signal intensities of c-Abl protein were compared to that of the control. (C) Rat1 cells were treated with 10 μM A23187 and harvested at the indicated times. Mitochondrial fractions were subjected to immunoprecipitation (IP) with anti-c-Abl. The precipitates were analyzed in a c-Abl kinase assay using GST-Crk(120–225) as the substrate or subjected to immunoblotting with anti-c-Abl. The signal intensities of c-Abl activity and protein were compared to that of the controls. (D) The increases in mitochondrial c-Abl protein (solid bars) and activity (open bars) are expressed as the means plus standard deviations obtained from three separate experiments.
FIG. 6
FIG. 6
Brefeldin A induces mitochondrial translocation of c-Abl. (A) Rat1 cells were treated with 10 μg of brefeldin A per ml for 8 h. Cytoplasmic and nuclear fractions were subjected to immunoblotting (IB) with anti-c-Abl, anti-β-actin, anti-PCNA, or anticalreticulin. (B) Rat1 cells were treated with 10 μg of brefeldin A per ml for the indicated times. Mitochondrial fractions were subjected to immunoblotting with anti-c-Abl or anti-HSP60. The signal intensities of c-Abl protein were compared to that of the control. (C) Rat1 cells were treated with 10 μg of brefeldin A per ml and harvested at the indicated times. Mitochondrial fractions were subjected to immunoprecipitation (IP) with anti-c-Abl. The precipitates were analyzed in a c-Abl kinase assay using GST-Crk(120–225) as the substrate or subjected to immunoblotting with anti-c-Abl. The signal intensities of c-Abl activity and protein were compared to that of the control. (D) The increases in mitochondrial c-Abl protein (solid bars) and activity (open bars) are expressed as the means plus standard deviations obtained from three separate experiments.
FIG. 6
FIG. 6
Brefeldin A induces mitochondrial translocation of c-Abl. (A) Rat1 cells were treated with 10 μg of brefeldin A per ml for 8 h. Cytoplasmic and nuclear fractions were subjected to immunoblotting (IB) with anti-c-Abl, anti-β-actin, anti-PCNA, or anticalreticulin. (B) Rat1 cells were treated with 10 μg of brefeldin A per ml for the indicated times. Mitochondrial fractions were subjected to immunoblotting with anti-c-Abl or anti-HSP60. The signal intensities of c-Abl protein were compared to that of the control. (C) Rat1 cells were treated with 10 μg of brefeldin A per ml and harvested at the indicated times. Mitochondrial fractions were subjected to immunoprecipitation (IP) with anti-c-Abl. The precipitates were analyzed in a c-Abl kinase assay using GST-Crk(120–225) as the substrate or subjected to immunoblotting with anti-c-Abl. The signal intensities of c-Abl activity and protein were compared to that of the control. (D) The increases in mitochondrial c-Abl protein (solid bars) and activity (open bars) are expressed as the means plus standard deviations obtained from three separate experiments.
FIG. 7
FIG. 7
ER stress induces cytochrome c release and apoptosis by a c-Abl-dependent mechanism. (A) MEF (c-Abl+/+) and c-Abl−/− cells were treated with 10 μM A23187 and harvested at the indicated times. Mitochondrial fractions were isolated and subjected to immunoblotting (IB) with anti-c-Abl or anti-HSP60. Cytoplasmic fractions were subjected to immunoblotting with anti-cytochrome c (Cyt c) or anti-β-actin. The signal intensities of c-Abl and cytochrome c were compared to that of the control. (B) MEF (c-Abl+/+) and c-Abl−/− cells were treated with 10 μg of brefeldin A per ml (Bref A) and harvested at the indicated times. Mitochondrial fractions were subjected to immunoblotting with anti-c-Abl or anti-HSP60. Cytoplasmic fractions were subjected to immunoblotting with anti-cytochrome c or anti-β-actin. (C) MEF (c-Abl+/+), Abl−/−, and Abl+ cells were treated with 10 μM A23187 for 6 h, 10 μg of brefeldin A per ml for 8 h, or 10 μg of tunicamycin per ml for 8 h. Mitochondrial fractions were analyzed by immunoblotting with anti-c-Abl and anti-HSP60. Cytoplasmic fractions were analyzed by immunoblotting with anti-cytochrome c and anti-β-actin. (D and E) MEF (c-Abl+/+), Abl−/−, and Abl+ cells were treated with 10 μM A23187 (D) or 10 μM of brefeldin A per ml (E) for the indicated times. ER fractions were analyzed by immunoblotting with anti-grp78 and anticalreticulin.
FIG. 7
FIG. 7
ER stress induces cytochrome c release and apoptosis by a c-Abl-dependent mechanism. (A) MEF (c-Abl+/+) and c-Abl−/− cells were treated with 10 μM A23187 and harvested at the indicated times. Mitochondrial fractions were isolated and subjected to immunoblotting (IB) with anti-c-Abl or anti-HSP60. Cytoplasmic fractions were subjected to immunoblotting with anti-cytochrome c (Cyt c) or anti-β-actin. The signal intensities of c-Abl and cytochrome c were compared to that of the control. (B) MEF (c-Abl+/+) and c-Abl−/− cells were treated with 10 μg of brefeldin A per ml (Bref A) and harvested at the indicated times. Mitochondrial fractions were subjected to immunoblotting with anti-c-Abl or anti-HSP60. Cytoplasmic fractions were subjected to immunoblotting with anti-cytochrome c or anti-β-actin. (C) MEF (c-Abl+/+), Abl−/−, and Abl+ cells were treated with 10 μM A23187 for 6 h, 10 μg of brefeldin A per ml for 8 h, or 10 μg of tunicamycin per ml for 8 h. Mitochondrial fractions were analyzed by immunoblotting with anti-c-Abl and anti-HSP60. Cytoplasmic fractions were analyzed by immunoblotting with anti-cytochrome c and anti-β-actin. (D and E) MEF (c-Abl+/+), Abl−/−, and Abl+ cells were treated with 10 μM A23187 (D) or 10 μM of brefeldin A per ml (E) for the indicated times. ER fractions were analyzed by immunoblotting with anti-grp78 and anticalreticulin.
FIG. 8
FIG. 8
ER stress induces apoptosis by a c-Abl-dependent mechanism. (A) MEF (c-Abl+/+) and c-Abl−/− cells were treated with 10 μM A23187 and harvested at the indicated times. After being fixed, cells were stained with propidium iodide, and sub-G1 DNA content was measured using FACScan. The percentage of apoptotic cells with sub-G1 DNA content is expressed as the means plus standard deviations from three independent experiments, each performed in duplicate. (B) MEF (c-Abl+/+) and Abl−/− cells were treated with 10 μg of brefeldin A per ml and harvested at the indicated times. (C) MEF (c-Abl+/+), Abl−/−, and Abl+ cells were treated with 10 μM A23187 for 6 h, 10 μg of brefeldin A per ml for 8 h, or 10 μg of tunicamycin per ml for 8 h. (D) Independently derived MEFs and Abl−/− cells were treated with 10 μg of tunicamycin per ml for 8 h. The percentage of apoptotic cells with sub-G1 DNA content is expressed as the means plus standard deviations from three independent experiments, each performed in duplicate.
FIG. 8
FIG. 8
ER stress induces apoptosis by a c-Abl-dependent mechanism. (A) MEF (c-Abl+/+) and c-Abl−/− cells were treated with 10 μM A23187 and harvested at the indicated times. After being fixed, cells were stained with propidium iodide, and sub-G1 DNA content was measured using FACScan. The percentage of apoptotic cells with sub-G1 DNA content is expressed as the means plus standard deviations from three independent experiments, each performed in duplicate. (B) MEF (c-Abl+/+) and Abl−/− cells were treated with 10 μg of brefeldin A per ml and harvested at the indicated times. (C) MEF (c-Abl+/+), Abl−/−, and Abl+ cells were treated with 10 μM A23187 for 6 h, 10 μg of brefeldin A per ml for 8 h, or 10 μg of tunicamycin per ml for 8 h. (D) Independently derived MEFs and Abl−/− cells were treated with 10 μg of tunicamycin per ml for 8 h. The percentage of apoptotic cells with sub-G1 DNA content is expressed as the means plus standard deviations from three independent experiments, each performed in duplicate.

References

    1. Agami R, Blandino G, Oren M, Shaul Y. Interaction of c-Abl and p73α and their collaboration to induce apoptosis. Nature. 1999;399:809–813. - PubMed
    1. Baskaran R, Wood L D, Whitaker L L, Xu Y, Barlow C, Canman C E, Morgan S E, Baltimore D, Wynshaw-Boris A, Kastan M B, Wang J Y J. Ataxia telangiectasia mutant protein activates c-abl tyrosine kinase in response to ionizing radiation. Nature. 1997;387:516–519. - PubMed
    1. Dricu A, Carlberg M, Wang M, Larsson O. Inhibition of N-linked glycosylation using tunicamycin causes cell death in malignant cells: role of down-regulation of the insulin-like growth factor 1 receptor in induction of apoptosis. Cancer Res. 1997;57:543–548. - PubMed
    1. Frangioni J V, Beahm P H, Shifrin V, Jost C A, Neel B G. The nontransmembrane tyrosine phosphatase PTP-1B localizes to the endoplasmic reticulum via its 35 amino acid C-terminal sequence. Cell. 1992;68:545–560. - PubMed
    1. Gething M, Sambrook J. Protein folding in the cell. Nature. 1992;355:33–45. - PubMed

Publication types

Substances