. 2001 Aug 15;15(16):2094-110.
doi: 10.1101/gad.894701.

Sequential actions of BMP receptors control neural precursor cell production and fate

Affiliations

Sequential actions of BMP receptors control neural precursor cell production and fate

D M Panchision et al. Genes Dev. .

Abstract

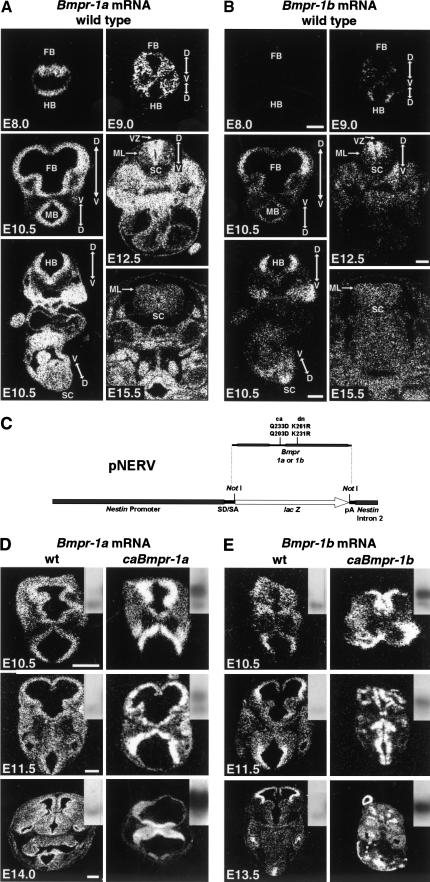
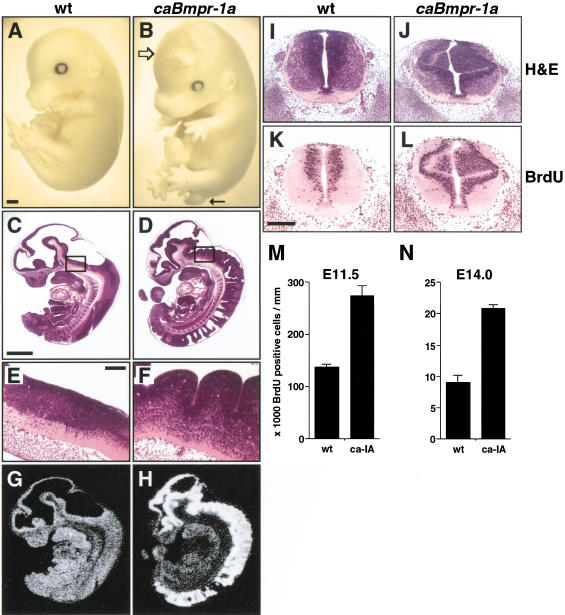
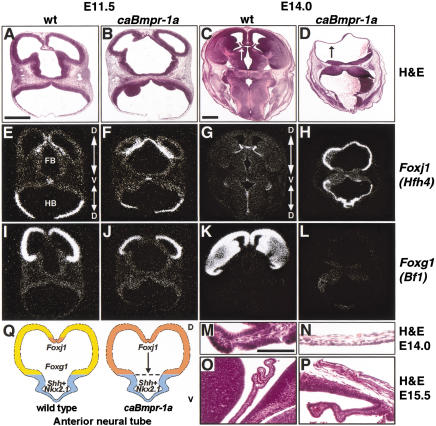
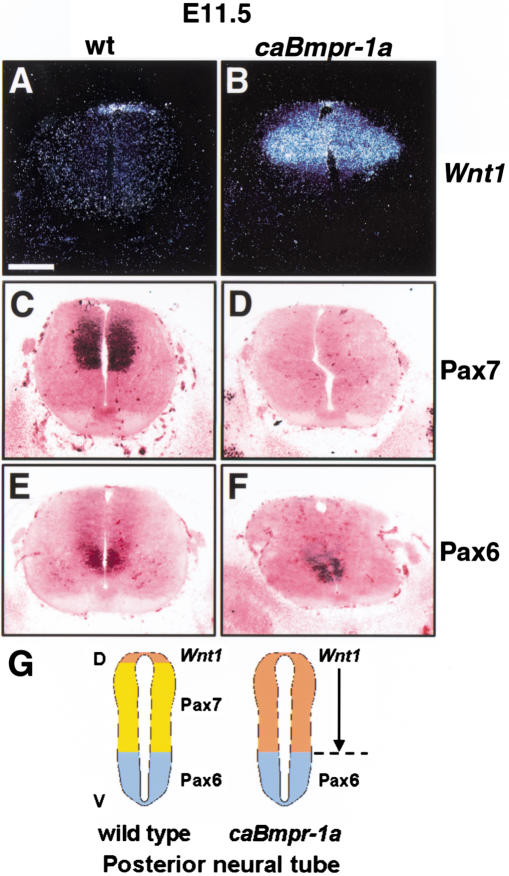
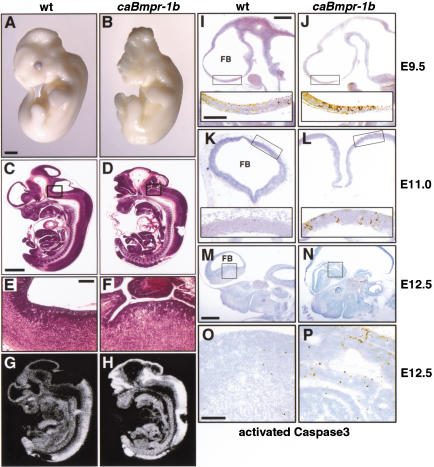
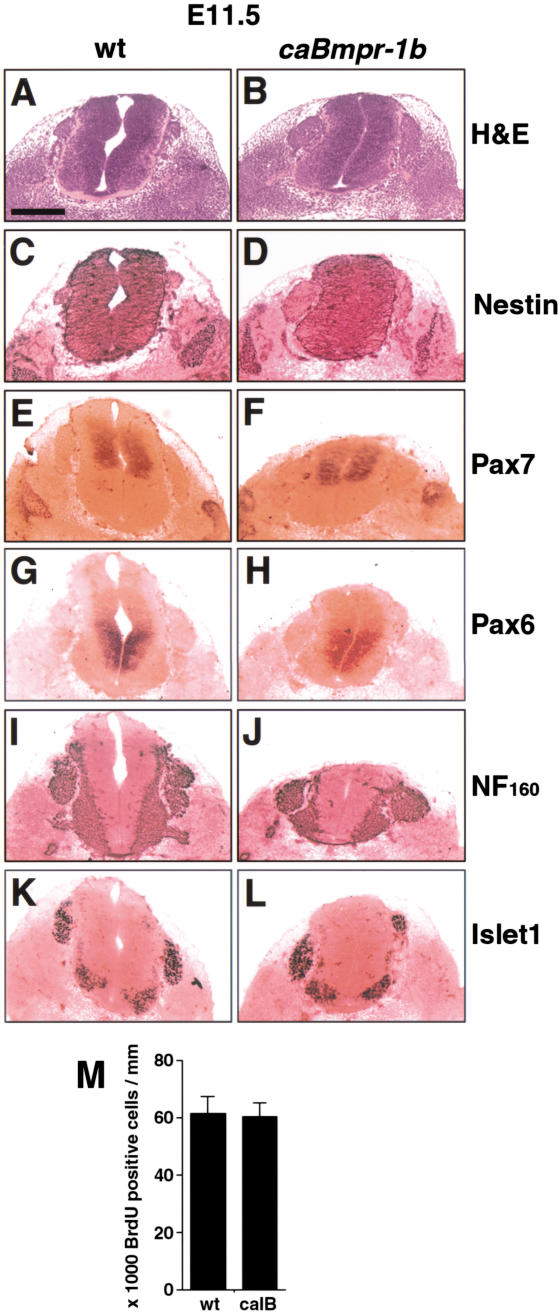
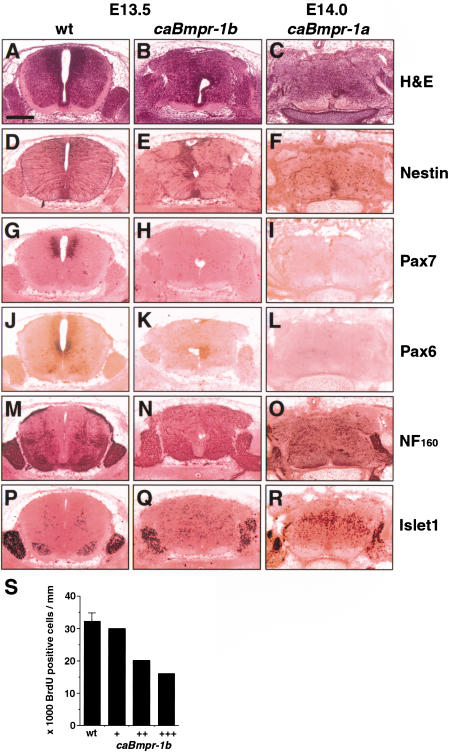
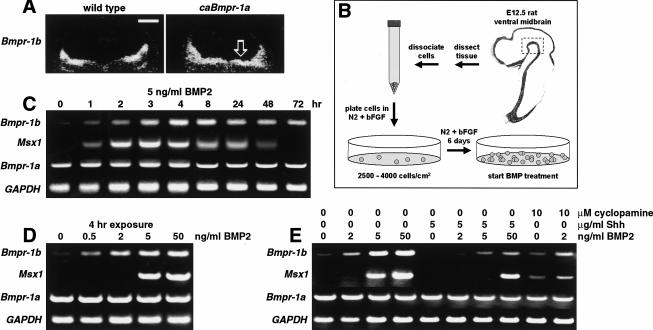
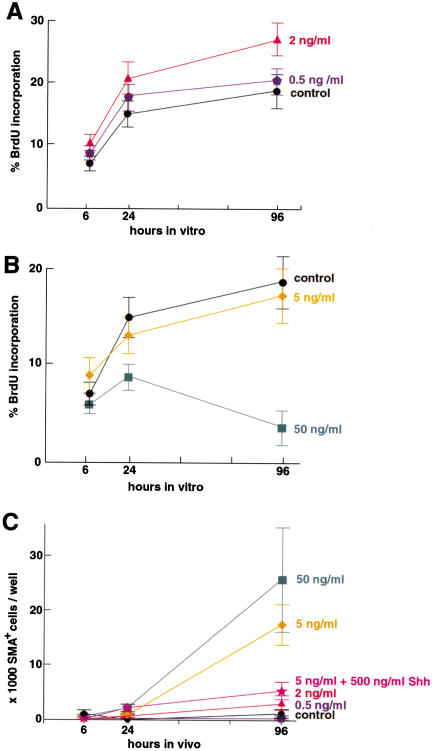
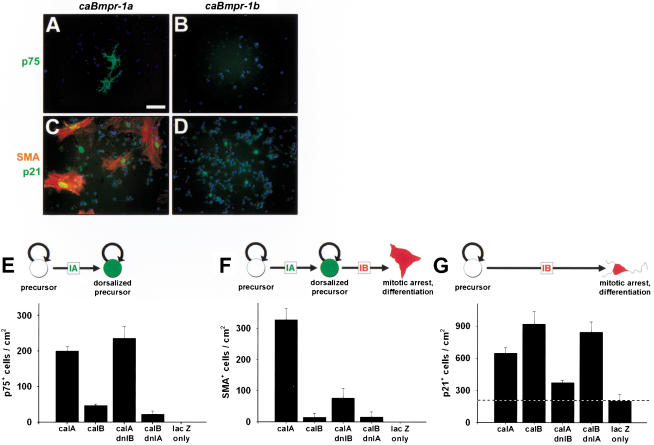
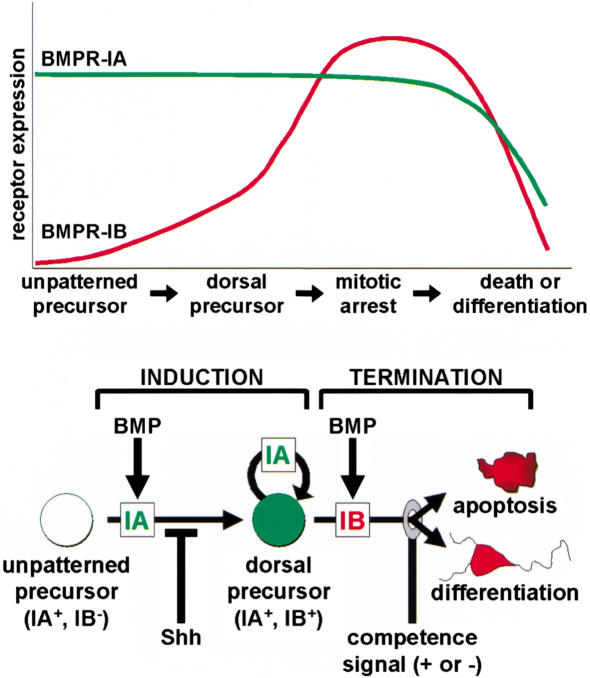
Bone morphogenetic proteins (BMPs) have diverse and sometimes paradoxical effects during embryonic development. To determine the mechanisms underlying BMP actions, we analyzed the expression and function of two BMP receptors, BMPR-IA and BMPR-IB, in neural precursor cells in vitro and in vivo. Neural precursor cells always express Bmpr-1a, but Bmpr-1b is not expressed until embryonic day 9 and is restricted to the dorsal neural tube surrounding the source of BMP ligands. BMPR-IA activation induces (and Sonic hedgehog prevents) expression of Bmpr-1b along with dorsal identity genes in precursor cells and promotes their proliferation. When BMPR-IB is activated, it limits precursor cell numbers by causing mitotic arrest. This results in apoptosis in early gestation embryos and terminal differentiation in mid-gestation embryos. Thus, BMP actions are first inducing (through BMPR-IA) and then terminating (through BMPR-IB), based on the accumulation of BMPR-IB relative to BMPR-IA. We describe a feed-forward mechanism to explain how the sequential actions of these receptors control the production and fate of dorsal precursor cells from neural stem cells.


Figures

Figure 1
Figure 1
Bmpr expression in wild-type and transgenic embryos. (A) In situ hybridization for Bmpr-1a on wild-type embryos showing normal expression pattern during development; note ubiquitous expression in proliferating ventricular zone and lack of expression in differentiated mantle layer. Dorsal–ventral axis of neural tube is indicated by arrows. (B) In situ hybridization for Bmpr-1b on wild-type embryos showing normal expression pattern during development; note that expression is restricted to dorsal proliferating neuroepithelium and is not expressed in postmitotic mantle layer. All images in A and B are from adjacent sections except for E15.5 sections. (C) Diagram of construct (pNERV) used to control expression of mutant bone morphogenetic protein (BMP) receptors for all experiments. (D,E) Examples of transgene expression at E10.5 (moderate copy number, c.n.), E11.5 (lower c.n.), and E13.5-E14.0 (high c.n.). In situ mRNA hybridization for Bmpr-1a (D) or Bmpr-1b (E) shows ratio of receptor mRNA expression in wild-type versus transgenic embryos. Insets show Southern blot of pNERV transgene band just above endogenous nestin second intron band. Note distinct phenotypes caused by each transgene. Also note diminished transgene expression in older embryos. D, Dorsal; V, ventral; FB, forebrain; MB, midbrain; HB, hindbrain; SC, spinal cord; VZ, ventricular zone; and ML, mantle layer. (A,B) Bar, 500 μm for E10.5 and 500 μm for E12.5 and E15.5; (D,E) bar, 200 μm for E10.5 and E11.5 and 500 μm for E13.5 and E14.0.
Figure 2
Figure 2
Excess proliferation in early neural tube in caBmpr-1a transgenic embryos. (A,B) Whole mount images at E15.5 show wild type versus pNERV.caBmpr-1a embryos; note the slight distortion of the cranium (open arrow) and the truncated tail (arrow). (C,D) Sagittal sections through E11.5 wild-type and caBmpr-1a embryos; note the extensive neuroepithelial gyrification in the transgenic embryos. (E,F) Higher (200×) magnification of hindbrain (box in C and D). (G,H) Bmpr-1a mRNA expression in wild-type and caBmpr-1a transgenic embryos shown in C and D. (I–L) Transverse sections showing hematoxylin and eosin and bromodeoxyuridine (BrdU) staining in E11.5 wt and caBmpr-1a transgenic embryos. (M,N) Bar graph indicating numbers of BrdU+ cells per unit spinal cord length in wild-type versus caBmpr-1a embryos at E11.5 and E14.0; P < 0.01. Bars: A–D,G,H, 1 mm; E,F,I–L, 200 μm.
Figure 3
Figure 3
Dorsalization of anterior neural tube in caBmpr-1a transgenic embryos. (A,B) Hematoxylin and eosin staining of E11.5 wild-type forebrain and hindbrain versus caBmpr-1a embryo with mild holoprosencephaly; transgene expression is shown in Figure 1D. (C,D) H&E staining of E14.0 wild-type forebrain and hindbrain versus caBmpr-1a holoprosencephalic neural tube; transgene expression is shown in Figure 1D. Compare the normal choroid plexus epithelium (white arrow in C, magnified in M) in wild-type embryo with the similar thin cuboidal epithelium (black arrow in D, magnified in N) of caBmpr-1a transgenic. (E,F) Foxj1 in situ hybridization on E11.5 wild-type and caBmpr-1a forebrain and hindbrain, showing expanded expression in the telencephalon and dorsal diencephalon of the transgenic embryo. Arrows mark orientation of dorsal–ventral axis. (G,H) Foxj1 in situ hybridization of E14.0 wild-type and caBmpr-1a forebrain and hindbrain, showing a complete of expansion of Foxj1 expression throughout the dorsal forebrain in transgenic embryo. (I,J) Foxg1 in situ hybridization of E11.5 wild-type and caBmpr-1a forebrain and hindbrain, showing diminished expression in transgenic embryo. (K,L) Foxg1 in situ hybridization of E14.0 wild-type and caBmpr-1a forebrain and hindbrain, showing complete loss of expression in transgenic embryo. (M,N) Higher (200×) magnification of area labeled by arrows in C,D. (O,P) High (200×) magnification of E15.5 wild-type choroid plexus (O) and ectopic choroid-like structure in caBmpr-1a embryo (P). (Q) Graphic summarizing the results of Figure 3. Activation of BMPR-IA results in the expansion of the dorsal-most domain (expressing Foxj1) at the expense of less-dorsal domains (expressing Foxg1), whereas ventralizing signal(s) prevent the dorsalization of the most ventral domain (Shh/Nkx2.1 based on data from Golden et al. 1999). Bars: A,B,E,F,I,J, 1 mm; C,D,G,H,K,L, 1 mm; M–P, 100 μm.
Figure 4
Figure 4
Dorsalization of posterior neural tube in caBmpr-1a transgenic embryos. Thoracic level of E11.5 to E12.0 spinal cord. (A,B) Wnt1, which marks the roof plate and dorsal commissural precursors, has an expanded expression domain in caBmpr-1a embryos (moderate copy number). (C,D) Pax7, which marks the dorsal spinal cord exclusive of the dorsal-most domain in mice (C), is diminished in caBmpr-1a embryos (D). (E,F) Pax6, which is expressed ventrally (E), is unaffected in caBmpr-1a embryos (F). (G) Graphic summarizing the results of Figure 4; see legend of Figure 3Q. Bar, 200 μm.
Figure 5
Figure 5
Apoptosis in early gestation caBmpr-1b transgenic embryos. (A,B) Whole-mount images at E11.5 show the normally closed neural tube in wild-type embryos versus exencephaly and severe craniofacial defects in pNERV.caBmpr-1b embryos. (C,D) Sagittal section through E12.5 wild-type and caBmpr-1b embryos shows that in transgenic embryos the neural tube is opened and folded back; hematomas are often present in associated vasculature. (E,F) Higher magnification of boxed area in C,D. (G,H) Bmpr-1b mRNA expression in wild-type and caBmpr-1b transgenic embryos shown in C,D. (IP) Forebrain staining for the activated proteolytic fragment of Caspase3 in wild-type and caBmpr-1b embryo. At E9.5 (I,J; sagittal section, low copy number, c.n.), an enhanced level of activated Caspase3 is seen in caBmpr-1b embryos preceding gross morphological defects; boxed area of forebrain is magnified to show labeled cells in inset. At E11.0 (K,L; transverse section, moderate c.n.), activated Caspase3 levels remain high in caBmpr-1b embryos as neural tube opening is observed in some areas. By E12.5 (M,N; sagittal section, moderate c.n.), high levels of activated Caspase3 in caBmpr-1b embryos are accompanied by neural tube collapse or complete exencephaly. (O,P) Higher (200×) magnification of ganglionic eminence labeled by box in M and N. Bars: A–D,G,H, 1 mm; E,F, 200 μm; I–L, 200 μm (low magnification); I–L (insets), O,P, 100 μm; M,N, 500 μm.
Figure 6
Figure 6
Lack of terminal differentiation in early gestation caBmpr-1b transgenic embryos. Lumbar level of E11.5 spinal cord. (A,B) hematoxylin and eosin staining shows well-defined boundaries in wild-type embryos and caBmpr-1b embryos (moderate copy number). Note collapsed ventricular lumen in caBmpr-1b embryo, similar to that seen in anterior neural tube (Fig. 5). (CL) Staining with markers of precursor cells such as nestin, Pax7, and Pax6 shows no change in precursor identity or dorsoventral patterning. Staining with the differentiated cell markers NF160 and Islet1 shows no change. (M) Bar graph indicating no change in numbers of BrdU+ cells per unit spinal cord length in wild-type versus caBmpr-1b embryos at E11.5. Bar, 200 μm.
Figure 7
Figure 7
Terminal differentiation in mid-gestation transgenic embryos. Lumbar level of E13.5 wt, E13.5 caBmpr-1b (moderate copy number, c.n.) and E14.0 caBmpr-1a (high c.n.) spinal cord. (AC) Hematoxylin and eosin staining shows well-defined boundaries in wild-type embryos compared with loss of boundaries in both caBmpr-1b and caBmpr-1a embryos; note migratory response. (DL) Staining with markers of precursor cells such as nestin, Pax7, and Pax6 show a reduction or elimination of staining in caBmpr-1b and caBmpr-1a embryos. (MR) Staining with markers of differentiated cells such as NF160 and Islet1 shows an increase in number and/or area of expression in caBmpr-1b and caBmpr-1a embryos. Note the migration of Islet1+ cells and the spreading of NF160-positive fibers throughout the spinal cord and out of the dorsal and ventral roots. (S) Bar graph indicating numbers of BrdU+ cells per unit spinal cord length in E13.5 wild-type versus caBmpr-1b embryos; variability between transgenic animals reflects variable penetrance of the phenotype. Bar, 200 μm.
Figure 8
Figure 8
Induction of Bmpr-1b expression by BMP2 and caBmpr-1a. (A) In situ hybridization for Bmpr-1b on transverse hindbrain sections of E11.5 wild-type and caBmpr-1a embryos; open arrow indicates ectopic Bmpr-1b expression in ventral hindbrain. (B) Diagram showing isolation and culturing of E12.5 rat ventral midbrain (VM) stem cells. (C) RT–PCR of E12.5 VM stem cells showing induction of Bmpr-1b and Msx1 within 2 to 4 h of treatment with 5 ng/mL BMP2; Bmpr-1a and GAPDH expression are unchanged. (D) Induction of Bmpr-1b and Msx1 by rtPCR in E12.5 VM stem cells after 4-h treatment with varying doses of BMP2. (E) Induction of Bmpr-1b and Msx1 at 4 h is inhibited by Shh cotreatment; inhibition of Shh by cyclopamine promotes induction of Bmpr-1b and Msx1. Bar, 500 μm.
Figure 9
Figure 9
Dose-dependent control of precursor cell number and differentiation by BMP2. (A) Continuous treatment with low doses of BMP2 lead to increased percentage of bromodeoxyuridine-positive (BrdU+) E12.5 ventral midbrain (VM) stem cells. BMP2 at 2 ng/mL significantly increases percentage BrdU+ cells at 6 h compared with control. (B) Higher doses of BMP2 lead to decreased percentage of BrdU+ E12.5 VM stem cells. (C) High doses of BMP2 cause both dorsalization and differentiation of E12.5 VM stem cells, as measured by smooth muscle α-actin (SMA)+ cell number. Note that the doses causing terminal differentiation also cause maximal Bmpr-1b induction (see Fig. 8); n = 3 for each experiment.
Figure 10
Figure 10
Sequential actions of bone morphogenetic protein (BMP) receptors on dorsal precursor production and fate. (AD) Antibody staining for p75NGFR (marking dorsalized precursors), smooth muscle α-actin (SMA; dorsalized and differentiated), and p21cip1 (mitotic arrest) in caBmpr-1a or caBmpr-1b transfected cultures. (EG) Quantitation of p75NGFR, SMA, and p21cip1 staining in DG after transfecting E14.5 cortical stem cells with pNERV driving caBmpr-1a (caIA); caBmpr-1b (caIB); double transfection with caIA plus dnIB; caIB plus dnIA; or lacZ only. Actions of BMPR-IA and BMPR-IB can be dissociated, showing that BMPR-IA acts first to instruct precursor cells, while BMPR-IB acts later to terminally differentiate cells. Dotted line in G marks baseline of p21cip1 staining caused by confluent cultures at the time of fixation; n = 3 or 4 for each experiment. Bar, A–D, 50 μm.
Figure 11
Figure 11
Induction–termination model for BMP receptor actions. In the induction phase, a precursor cell in the early postgastrulation embryo expresses only BMPR-IA and responds to BMPs by expressing dorsal identity genes (including Bmpr-1b) and by proliferating. This response is blocked in cells of the ventral domain by the actions of Shh. The termination phase occurs when cell surface levels of accumulating BMPR-IB exceed those of BMPR-IA, so that a cell responds to BMPs with mitotic arrest. Changing competence signals (+) interpret the response to BMPR-IB so that an early precursor cell terminates by apoptosis while a later precursor cell terminates by differentiation; inhibitory signals (−) can delay termination response.

Similar articles

Cited by

References

    1. Altmann CR, Brivanlou AH. Neural patterning in the vertebrate embryo. Int Rev Cytol. 2001;203:447–482. - PubMed
    1. Amthor H, Christ B, Weil M, Patel K. The importance of timing differentiation during limb muscle development. Curr Biol. 1998;8:642–652. - PubMed
    1. Amthor H, Christ B, Patel K. A molecular mechanism enabling continuous embryonic muscle growth: A balance between proliferation and differentiation. Development. 1999;126:1041–1053. - PubMed
    1. Arkell R, Beddington RS. BMP-7 influences pattern and growth of the developing hindbrain of mouse embryos. Development. 1997;124:1–12. - PubMed
    1. Bachiller D, Klingensmith J, Kemp C, Belo JA, Anderson RM, May SR, McMahon JA, McMahon AP, Harland RM, Rossant J, et al. The organizer factors Chordin and Noggin are required for mouse forebrain development. Nature. 2000;403:658–661. - PubMed

MeSH terms

LinkOut - more resources