. 2001 Sep;183(18):5395-401.
doi: 10.1128/JB.183.18.5395-5401.2001.

Alginate overproduction affects Pseudomonas aeruginosa biofilm structure and function

Affiliations

Alginate overproduction affects Pseudomonas aeruginosa biofilm structure and function

M Hentzer et al. J Bacteriol. 2001 Sep.

Abstract

During the course of chronic cystic fibrosis (CF) infections, Pseudomonas aeruginosa undergoes a conversion to a mucoid phenotype, which is characterized by overproduction of the exopolysaccharide alginate. Chronic P. aeruginosa infections involve surface-attached, highly antibiotic-resistant communities of microorganisms organized in biofilms. Although biofilm formation and the conversion to mucoidy are both important aspects of CF pathogenesis, the relationship between them is at the present unclear. In this study, we report that the overproduction of alginate affects biofilm development on an abiotic surface. Biofilms formed by an alginate-overproducing strain exhibit a highly structured architecture and are significantly more resistant to the antibiotic tobramycin than a biofilm formed by an isogenic nonmucoid strain. These results suggest that an important consequence of the conversion to mucoidy is an altered biofilm architecture that shows increasing resistance to antimicrobial treatments.


Figures
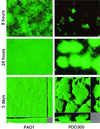
FIG. 1
FIG. 1
Epifluorescence and scanning confocal photomicrographs of the surface-attached communities formed by P. aeruginosa wild type and an isogenic alginate-overproducing mutant. The strains are engineered to contain a gfp expression cassette inserted into the chromosome. The biofilms are grown in once flow-through continuous-culture reaction vessels. (Top) Epifluorescence photomicrographs of the wild type (PAO1) and the mucA22 mutant (PDO300); images were acquired 8 h postinoculation of the biofilm reactor. (Middle) Epifluorescence photomicrographs acquired 24 h postinoculation. (Bottom) Scanning confocal photomicrographs of 5-day-old wild-type and mucA22 mutant biofilms. The larger central plots are simulated fluorescent projections, in which a long shadow indicates a large, high microcolony. Shown in the right and lower frames are vertical sections through the biofilms collected at the positions indicated by the white triangles. Bar, 20 μm.
FIG. 2
FIG. 2
Biofilm formation assay comparing the total biofilm biomasses of PAO1, PDO300, and algDmucA strains after 10 h. Biofilms were prepared and stained as described in Materials and Methods. Both PDO300 and the algDmucA double mutant harbored less biomass in their biofilms than did PAO1. Each value was the average of 32 individual replicates. Avg, average; St. dev., standard deviation.
FIG. 3
FIG. 3
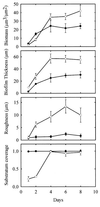
Characteristics of P. aeruginosa wild-type (filled circles) and mucA22 mutant (open circles) biofilms. The biomass content, biofilm thickness, roughness coefficient, and substratum coverage were calculated by the COMSTAT image analysis software from scanning confocal image data. The values are averages of six image stacks acquired in four separate experiments. The biomass content is calculated as the biomass volume (μm3) per substratum surface area (μm2). The roughness coefficient describes the variation in biofilm thickness and is a measure of biofilm heterogeneity. The substratum coverage is the fraction of the substratum area covered by biomass. The times at which the biofilms were assayed were 1, 2, 4, 6, and 8 days (as indicated on the x axis).
FIG. 4
FIG. 4
Increased tobramycin resistance of a P. aeruginosa PDO300 biofilm. (A) Viable biomass content of gfp-expressing P. aeruginosa wild-type and PDO300 mutant biofilms after 24 h of exposure to 2.0 μg of tobramycin per ml (open bars) and nontreated controls (filled bars). gfp fluorescence is a marker of cell viability and allows quantification of the viable biomass by COMSTAT image analysis of SCLM image data. (B) Visualization of live (green fluorescence) and dead (red fluorescence) cells by LIVE/DEAD BacLight bacterial viability staining kit. The treated biofilms were exposed to tobramycin as described above. Viability was measured by GFP fluorescence (A) and by SYTO 9 viability staining (B).
FIG. 5
FIG. 5
Assay of tobramycin sensitivity in a rotating-disk biofilm reactor system. ○, P. aeruginosa wild-type biofilm; ●, PDO300 mutant biofilm. The values represent averages of three separate experiments. Biofilms were treated for 5 h. The planktonic MIC of tobramycin for both these strains is 1 μg/ml.

Similar articles

Cited by

References

    1. Andersen J B, Sternberg C, Poulsen L K, Bjorn S P, Givskov M, Molin S. New unstable variants of green fluorescent protein for studies of transient gene expression in bacteria. Appl Environ Microbiol. 1998;64:2240–2246. - PMC - PubMed
    1. Anwar H, Strap J L, Chen K, Costerton J W. Dynamic interactions of biofilms of mucoid Pseudomonas aeruginosa with tobramycin and piperacillin. Antimicrob Agents Chemother. 1992;36:1208–1214. - PMC - PubMed
    1. Baselga R, Albizu I, De La Cruz M, Del Cacho E, Barberan M, Amorena B. Phase variation of slime production in Staphylococcus aureus: implications in colonization and virulence. Infect Immun. 1993;61:4857–4862. - PMC - PubMed
    1. Christensen B B, Sternberg C, Andersen J B, Palmer R J, Jr, Nielsen A T, Givskov M, Molin S. Molecular tools for study of biofilm physiology. Methods Enzymol. 1999;310:20–42. - PubMed
    1. Costerton J W, Lewandowski Z, Caldwell D E, Korber D R, Lappin-Scott H M. Microbial biofilms. Annu Rev Microbiol. 1995;49:711–745. - PubMed

Publication types

MeSH terms