. 2001 Aug 20;154(4):691-7.
doi: 10.1083/jcb.200012098.

The BPAG1 locus: Alternative splicing produces multiple isoforms with distinct cytoskeletal linker domains, including predominant isoforms in neurons and muscles

Affiliations

The BPAG1 locus: Alternative splicing produces multiple isoforms with distinct cytoskeletal linker domains, including predominant isoforms in neurons and muscles

C L Leung et al. J Cell Biol. .

Abstract

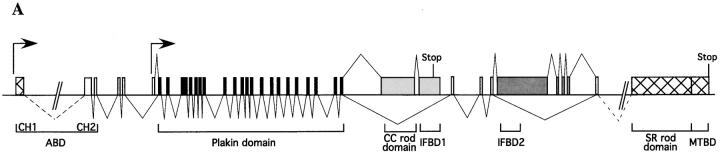
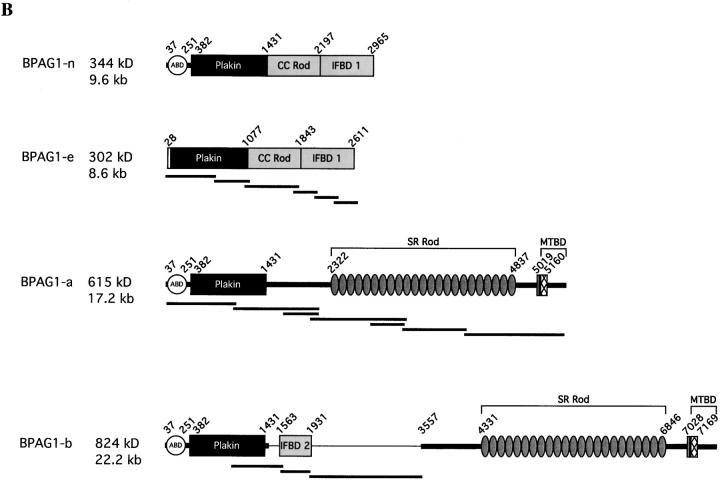
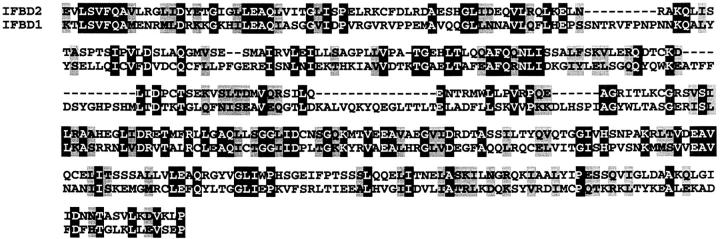
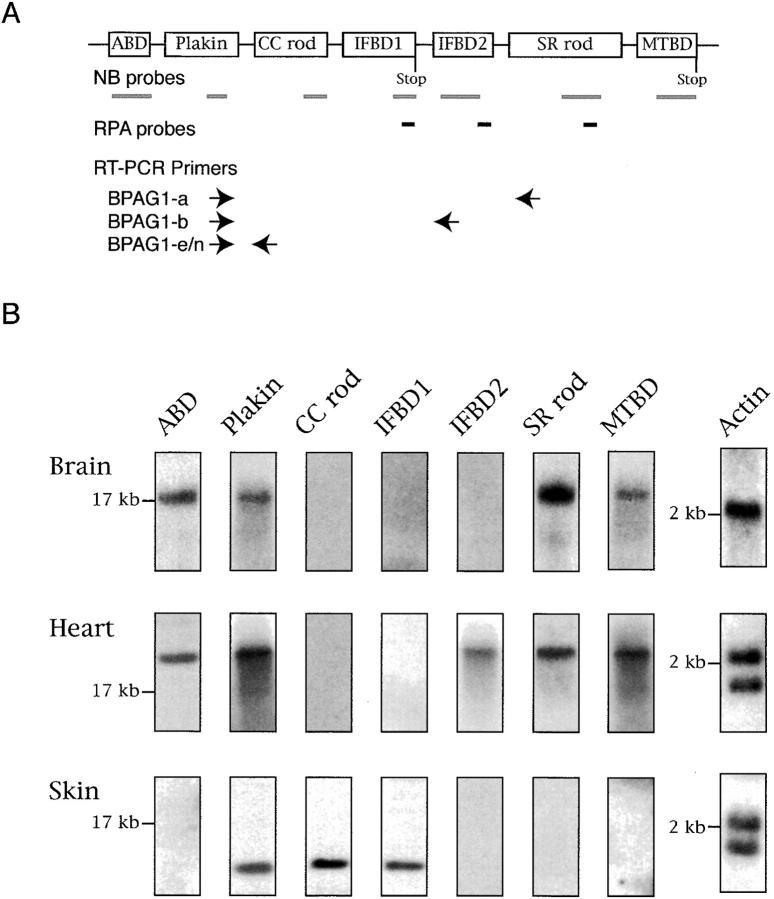
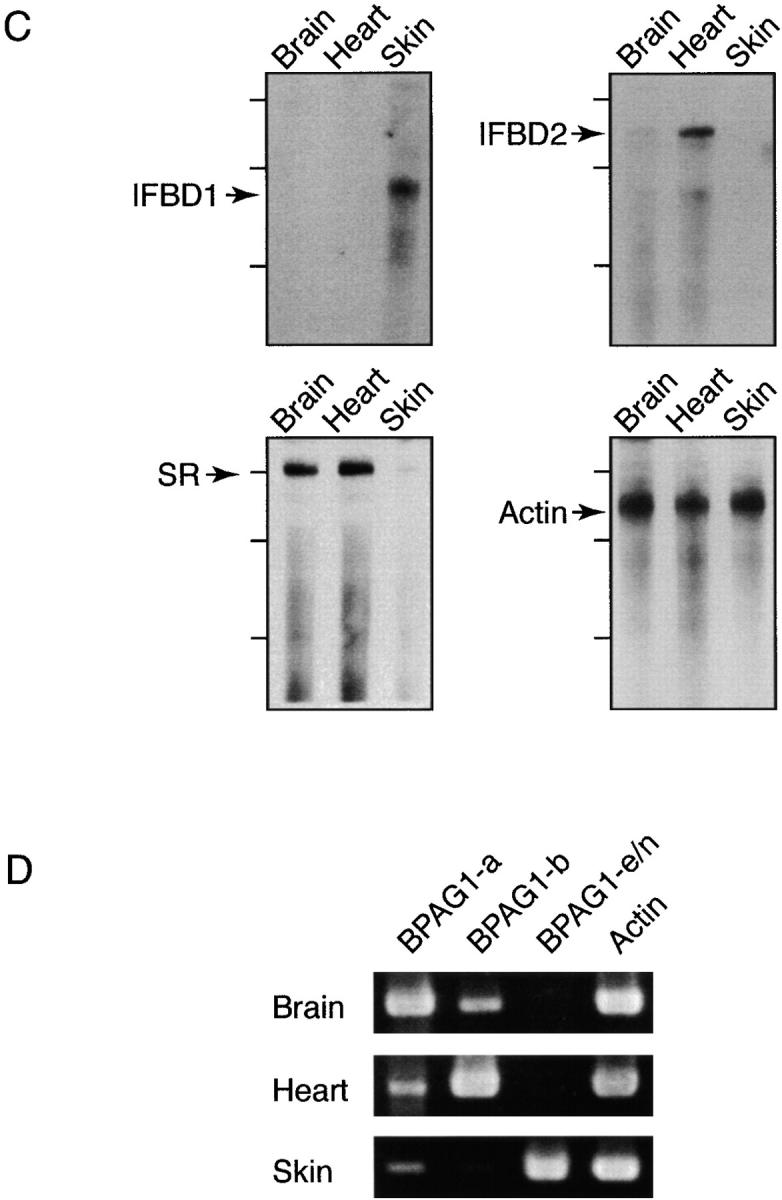
Bullous pemphigoid antigen 1 (BPAG1) is a member of the plakin family with cytoskeletal linker properties. Mutations in BPAG1 cause sensory neuron degeneration and skin fragility in mice. We have analyzed the BPAG1 locus in detail and found that it encodes different interaction domains that are combined in tissue-specific manners. These domains include an actin-binding domain (ABD), a plakin domain, a coiled coil (CC) rod domain, two different potential intermediate filament-binding domains (IFBDs), a spectrin repeat (SR)-containing rod domain, and a microtubule-binding domain (MTBD). There are at least three major forms of BPAG1: BPAG1-e (302 kD), BPAG1-a (615 kD), and BPAG1-b (834 kD). BPAG1-e has been described previously and consists of the plakin domain, the CC rod domain, and the first IFBD. It is the primary epidermal BPAG1 isoform, and its absence that is the likely cause of skin fragility in mutant mice. BPAG1-a is the major isoform in the nervous system and a homologue of the microtubule actin cross-linking factor, MACF. BPAG1-a is composed of the ABD, the plakin domain, the SR-containing rod domain, and the MTBD. The absence of BPAG1-a is the likely cause of sensory neurodegeneration in mutant mice. BPAG1-b is highly expressed in muscles, and has extra exons encoding a second IFBD between the plakin and SR-containing rod domains of BPAG1-a.


Figures

Figure 1.
Figure 1.
The genomic structure of BPAG1 and the predicted architecture of BPAG1 isoforms. (A) The structure of the 5′ portion of BPAG1 gene is illustrated. The putative promoters are indicated by arrows. The plakin domain is encoded by 21 exons (black), whereas the CC rod domain and the IFBD1 are each coded by a single exon (light gray). The dark gray boxes represent exons specific for BPAG1-b that contain the IFBD2. Exons and cDNA (hatched boxes) that harbor a stop codon are marked. (B) Schematic representation of the domain structure of BPAG1 isoforms. The names of BPAG1 isoforms, their predicted molecular masses, and the length of their composite cDNAs are indicated. Bold lines underneath the schematic protein drawings represent nested PCR products. The names of individual domains are indicated, except for the EF-hand calcium binding motifs (small gray boxes) and the MT-binding Gas-2–related domain (hatched boxes). The numbers of the amino acids that mark the boundaries of each domain are also shown.
Figure 1.
Figure 1.
The genomic structure of BPAG1 and the predicted architecture of BPAG1 isoforms. (A) The structure of the 5′ portion of BPAG1 gene is illustrated. The putative promoters are indicated by arrows. The plakin domain is encoded by 21 exons (black), whereas the CC rod domain and the IFBD1 are each coded by a single exon (light gray). The dark gray boxes represent exons specific for BPAG1-b that contain the IFBD2. Exons and cDNA (hatched boxes) that harbor a stop codon are marked. (B) Schematic representation of the domain structure of BPAG1 isoforms. The names of BPAG1 isoforms, their predicted molecular masses, and the length of their composite cDNAs are indicated. Bold lines underneath the schematic protein drawings represent nested PCR products. The names of individual domains are indicated, except for the EF-hand calcium binding motifs (small gray boxes) and the MT-binding Gas-2–related domain (hatched boxes). The numbers of the amino acids that mark the boundaries of each domain are also shown.
Figure 2.
Figure 2.
Primary sequences of mouse BPAG1 isoforms and comparison of the IFBDs. The IFBD of BPAG1-b (IFBD2; amino acids 1563–1931 of BPAG1-b) is compared with the IFBD of BPAG1-e (IFBD1; amino acids 2184–2598 of BPAG1-e). Identical amino acids are shaded in black with white letters, whereas the conserved amino acid changes are shaded in gray.
Figure 3.
Figure 3.
Analyses of BPAG1 mRNAs. (A) A schematic diagram showing the structure of the BPAG1 gene. Bold gray lines underneath individual domains represent the probes used for Northern blot (NB) analysis and in situ hybridizations. The positions of riboprobes (bold lines in black) used for RPA and oligonucleotide primers (arrows) used for RT-PCR analyses are illustrated. The names of the riboprobes corresponded to the BPAG1 structural domains that the riboprobes recognized. The primer sets were named after the BPAG1 isoforms that they amplified. (B) Northern blot analysis of BPAG1 isoforms. The positions of the 17-kb brain MACF mRNA and the 2-kb RNA standard are marked. The β-actin probe also detected other actin isoforms. (C) RPA analysis of BPAG1 isoforms. BPAG1 isoforms that contained the IFBD1 domain were only detected in skin. BPAG1-b transcripts that could be protected by IFBD2 probe were found in large amounts in the heart and small amounts in the brain. The SR-containing rod domain probe that protected both BPAG1-a and BPAG1-b mRNAs gave strong signals in brain and heart and weak signals in skin. Marker standards (100, 200, and 300 bp) are indicated on the left of each panel. (D) RT-PCR analyses of BPAG1 isoforms. The highest amounts of BPAG1-a and BPAG1-b were observed in brain and heart, respectively. BPAG1-e mRNAs were only found in the skin, whereas no BPAG1-e/n mRNAs were detected in the brain or the heart with these RT-PCR settings.
Figure 3.
Figure 3.
Analyses of BPAG1 mRNAs. (A) A schematic diagram showing the structure of the BPAG1 gene. Bold gray lines underneath individual domains represent the probes used for Northern blot (NB) analysis and in situ hybridizations. The positions of riboprobes (bold lines in black) used for RPA and oligonucleotide primers (arrows) used for RT-PCR analyses are illustrated. The names of the riboprobes corresponded to the BPAG1 structural domains that the riboprobes recognized. The primer sets were named after the BPAG1 isoforms that they amplified. (B) Northern blot analysis of BPAG1 isoforms. The positions of the 17-kb brain MACF mRNA and the 2-kb RNA standard are marked. The β-actin probe also detected other actin isoforms. (C) RPA analysis of BPAG1 isoforms. BPAG1 isoforms that contained the IFBD1 domain were only detected in skin. BPAG1-b transcripts that could be protected by IFBD2 probe were found in large amounts in the heart and small amounts in the brain. The SR-containing rod domain probe that protected both BPAG1-a and BPAG1-b mRNAs gave strong signals in brain and heart and weak signals in skin. Marker standards (100, 200, and 300 bp) are indicated on the left of each panel. (D) RT-PCR analyses of BPAG1 isoforms. The highest amounts of BPAG1-a and BPAG1-b were observed in brain and heart, respectively. BPAG1-e mRNAs were only found in the skin, whereas no BPAG1-e/n mRNAs were detected in the brain or the heart with these RT-PCR settings.
Figure 4.
Figure 4.
In situ hybridization of E14.5 embryos. (A) Sagittal section of mouse embryo hybridized with probe specific for the IFBD1. Hybridization signal was detected in the skin (short arrow) and mucosal epithelia of the digestive tract (long arrow). The weaker signal inside the trunk was apparently background hybridization, since it did not display any structural pattern. An identical hybridization pattern was obtained with a probe against the CC rod domain. (B) Sagittal section of mouse embryo hybridized with probe specific for the IFBD2. Strong hybridization signal was detected in the tongue (long arrow), heart (▸), skeletal muscle masses at the back (short arrow), and bone cartilage of the vertebrae (▹). Background hybridization was also apparent in the trunk. (C) Sagittal section of mouse embryo hybridized with probe specific for the MTBD. Similar hybridization patterns were also found with probes against the SR-containing rod domain and the ABD. High expression levels of BPAG1 isoforms that contain these domains were observed in the tongue (long arrow), the thymus (▸), and bone cartilage of the vertebrae (▹). In the nervous system, particularly strong signal was detected at the pituitary primordium (short arrow). Adjacent transverse sections hybridized with probes against the CC rod domain (D), IFBD1 (E), and MT-binding domain (F). Probes against the CC rod domain and IFBD1 detected BPAG1-e mRNA in the skin only. BPAG1-a labeled by the MTBD probe is highly expressed in the DRG (arrow). Bars: (A–C) 2 mm; (D–F) 0.5 mm.
Figure 5.
Figure 5.
Differential distribution of MACF and BPAG1-a/b. Adjacent transverse (A, B, and E–H) and sagittal (C and D) sections of embryonic-day-14.5 embryos were hybridized with probes prepared for the MTBD of BPAG1-a /b (A, C, E, and G) and MACF (B, D, F, and H). Hybridization signal of BPAG1-a was stronger than that of MACF in the DRG (short arrows, A and B) and metanephros (long arrows, A and B). Interestingly, there is a gradient of BPAG1-a/b distribution in the spinal cord with stronger signals detected on the ventral side (A). Note that BPAG1-a mRNA was expressed in the cartilage of the vertebrae, whereas MACF mRNA was expressed mostly in the mesenchymal tissues surrounding the developing vertebrae (C and D). Strong signals for BPAG1-b and MACF were found in the heart (E) and the lungs, respectively (H). Bars: (A and C) 0.5 mm; (H) 0.1 mm.

References

    1. Bernier, G., A. Brown, G. Dalpe, Y. De Repentigny, M. Mathieu, and R. Kothary. 1995. a. Dystonin expression in the developing nervous system predominates in the neurons that degenerate in dystonia musculorum mutant mice. Mol. Cell. Neurosci. 6:509–520. - PubMed
    1. Bernier, G., A. Brown, G. Dalpe, M. Mathieu, Y. De Repentigny, and R. Kothary. 1995. b. Dystonin transcripts are altered and their levels are reduced in the mouse neurological mutant dt24J. Biochem. Cell Biol. 73:605–609. - PubMed
    1. Bernier, G., Y. De Repentigny, M. Mathieu, S. David, and R. Kothary. 1998. Dystonin is an essential component of the Schwann cell cytoskeleton at the time of myelination. Development. 125:2135–2148. - PubMed
    1. Brown, A., G. Bernier, M. Mathieu, J. Rossant, and R. Kothary. 1995. The mouse dystonia musculorum gene is a neural isoform of bullous pemphigoid antigen 1. Nat. Genet. 10:301–306. - PubMed
    1. Dalpe, G., N. Leclerc, A. Vallee, A. Messer, M. Mathieu, Y. De Repentigny, and R. Kothary. 1998. Dystonin is essential for maintaining neuronal cytoskeleton organization. Mol. Cell. Neurosci. 10:243–257. - PubMed

Publication types

MeSH terms

Associated data