. 2001 Sep;142(9):4120-30.
doi: 10.1210/endo.142.9.8395.

ER beta inhibits proliferation and invasion of breast cancer cells

Affiliations

ER beta inhibits proliferation and invasion of breast cancer cells

G Lazennec et al. Endocrinology. 2001 Sep.

Abstract

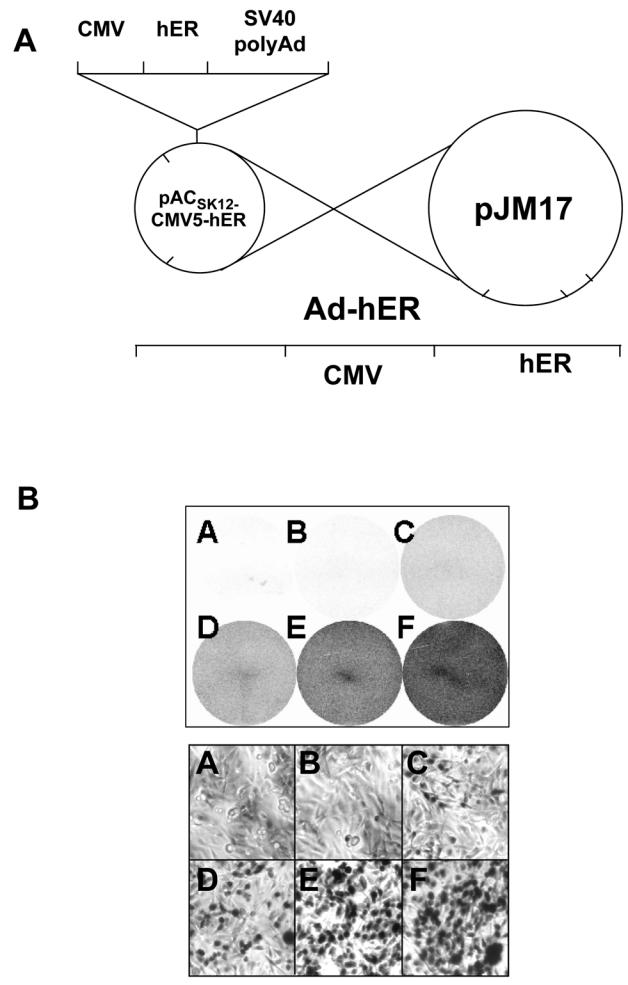
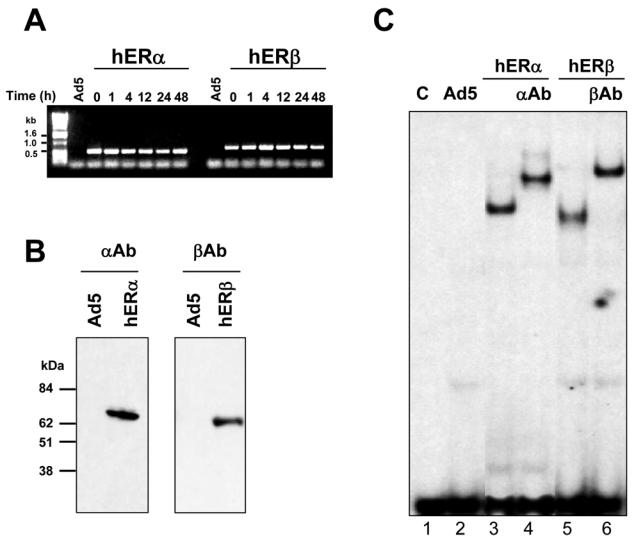
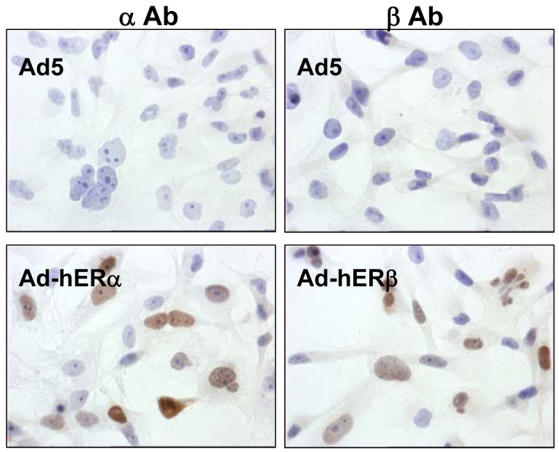
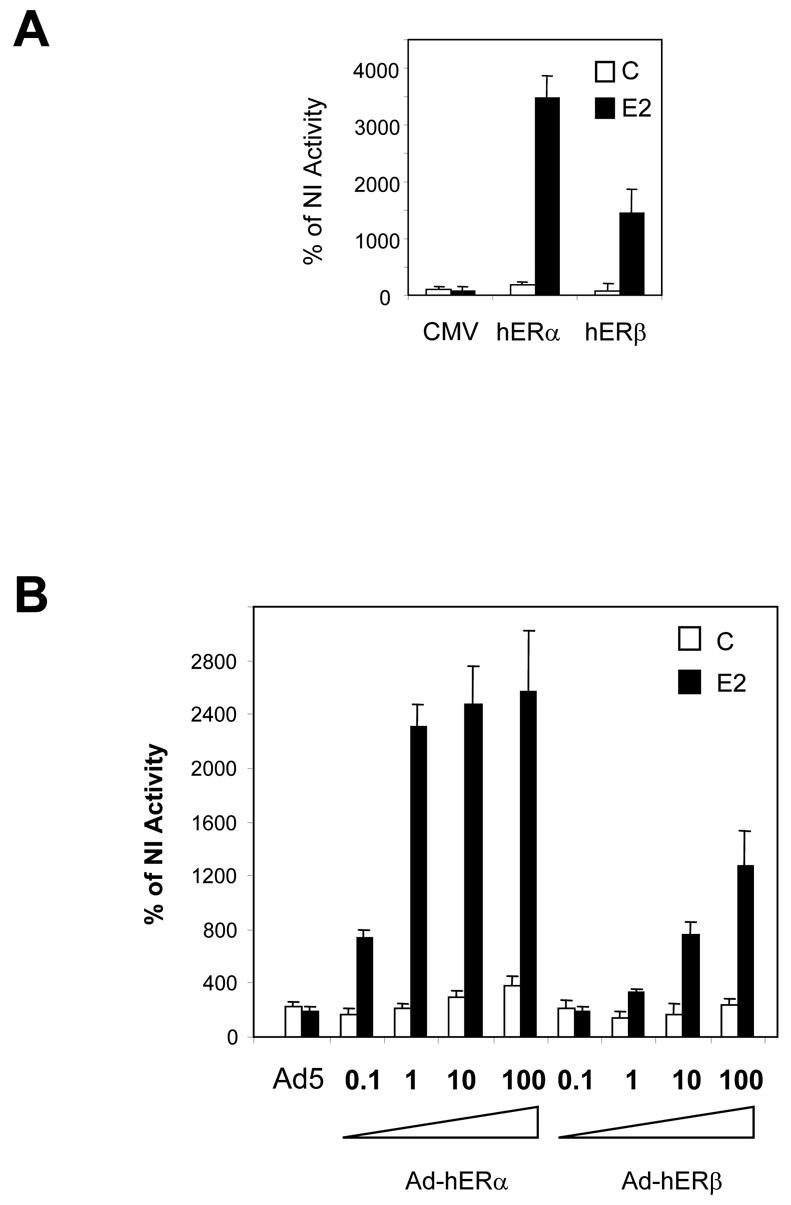
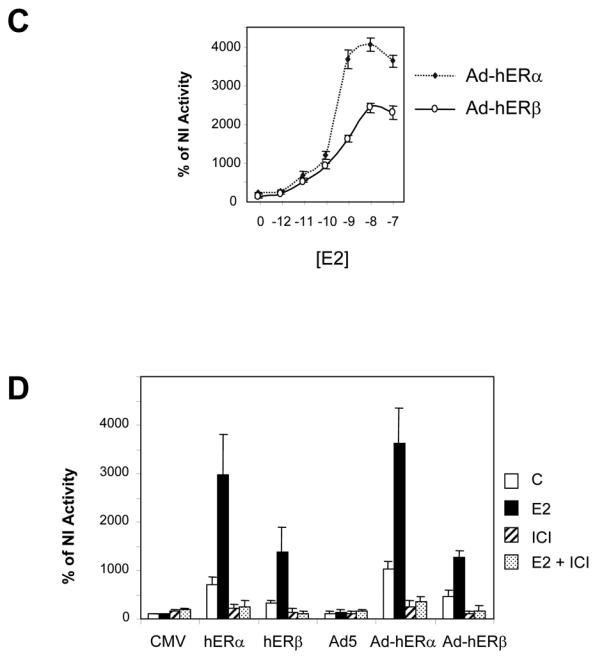
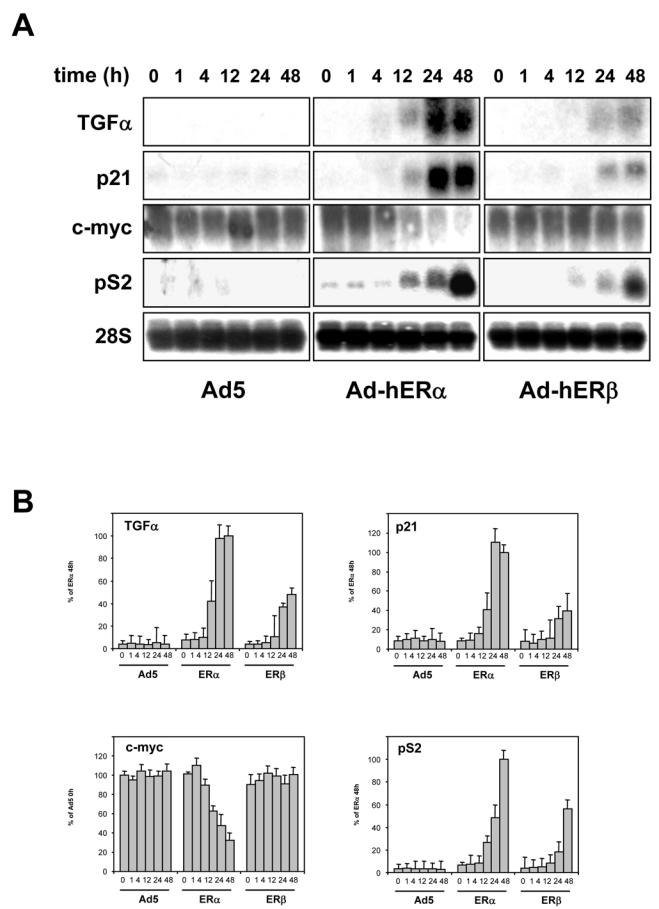
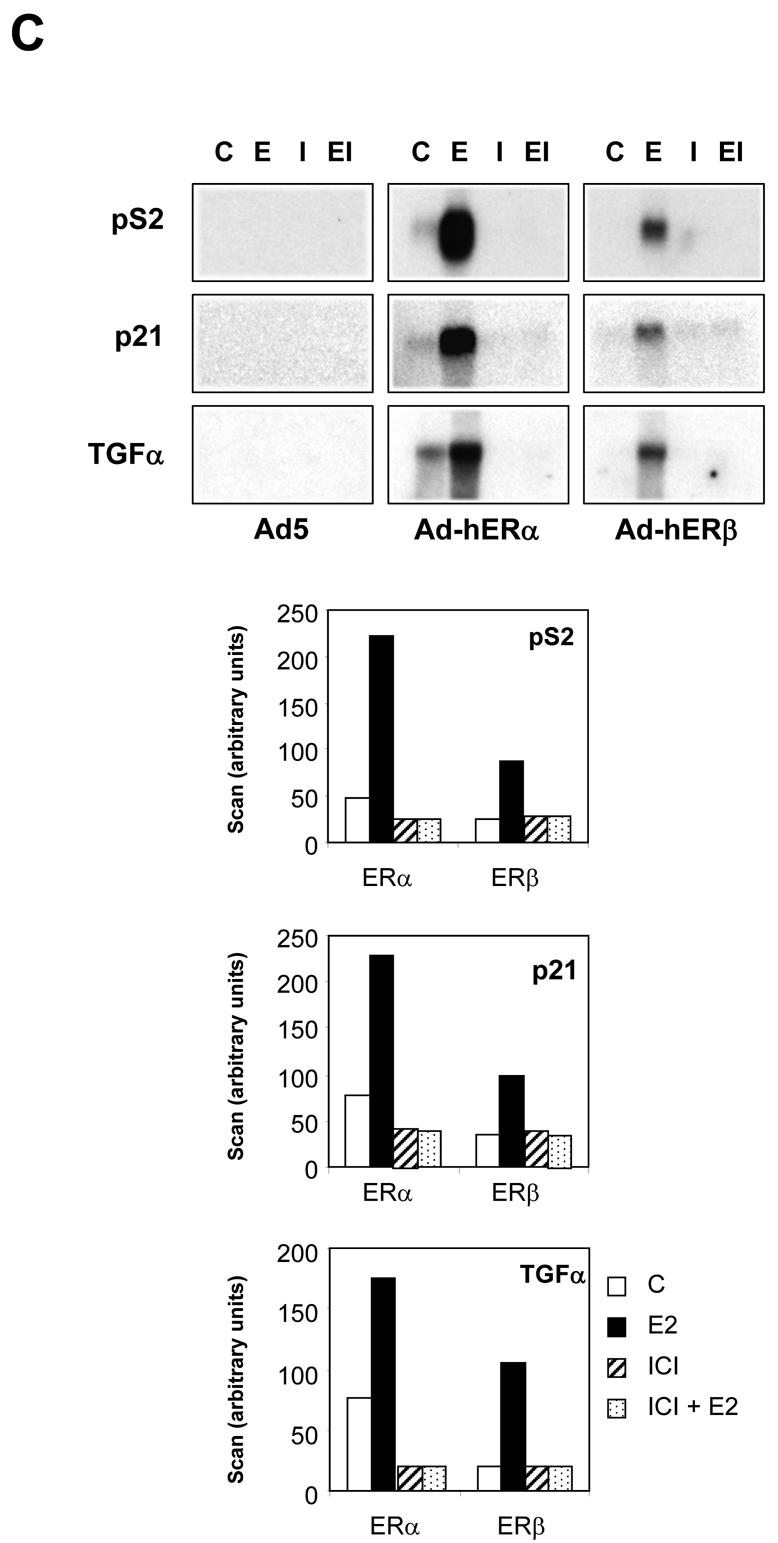
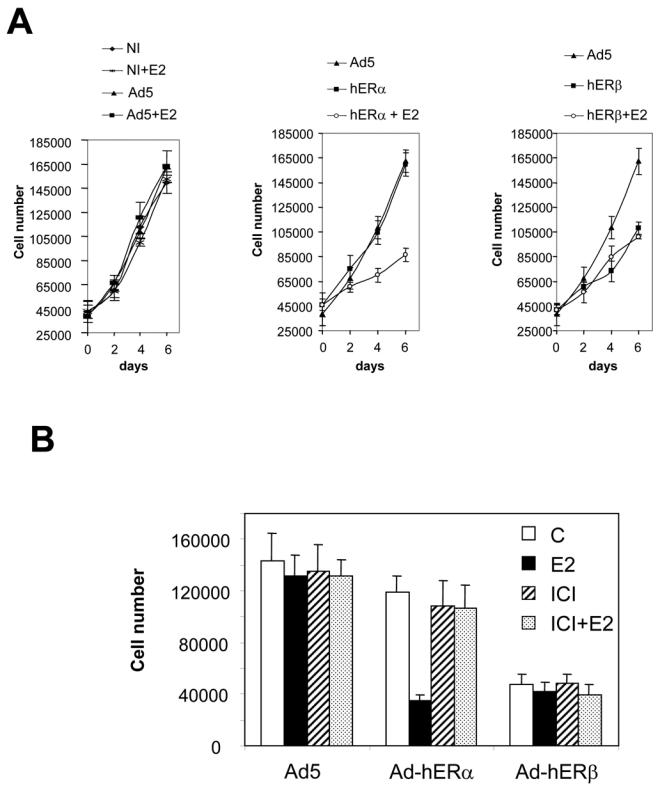
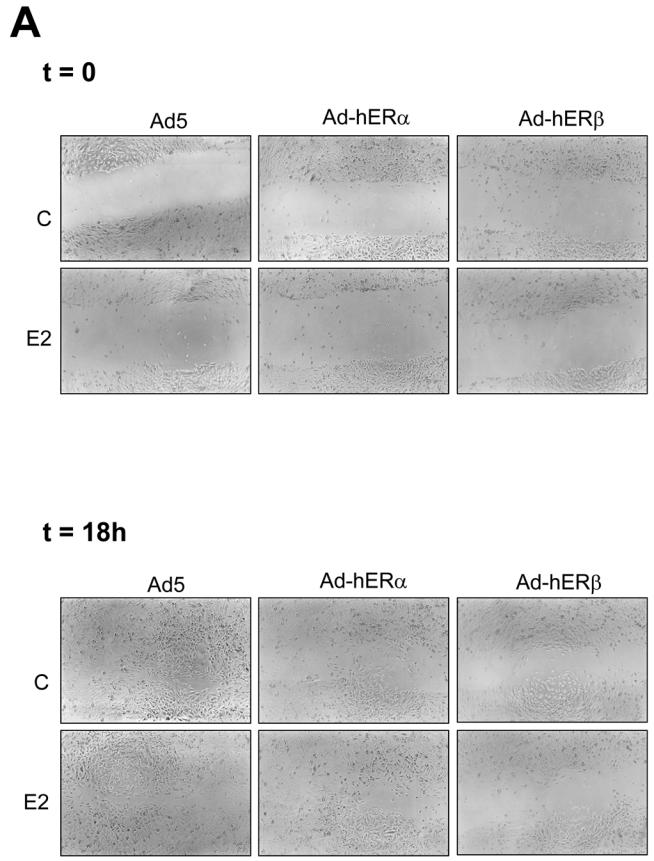
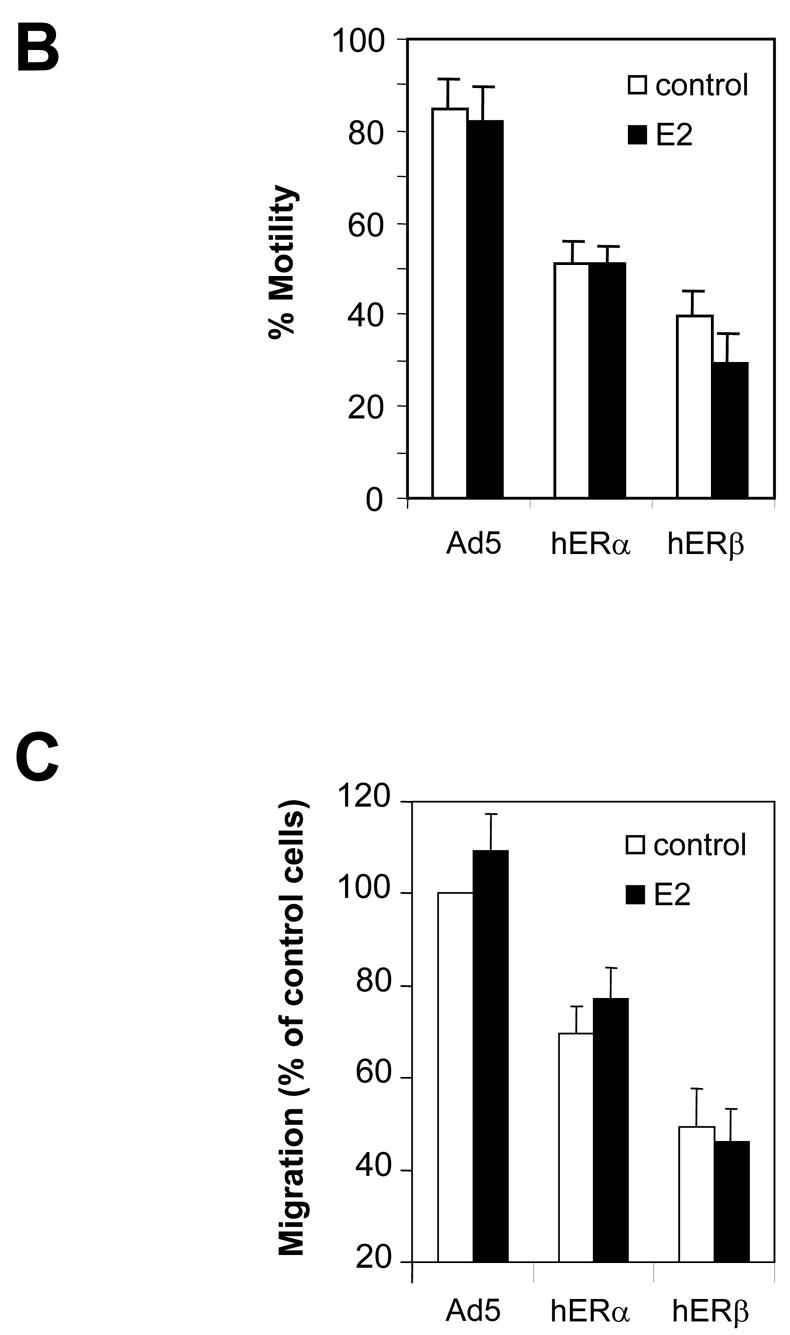
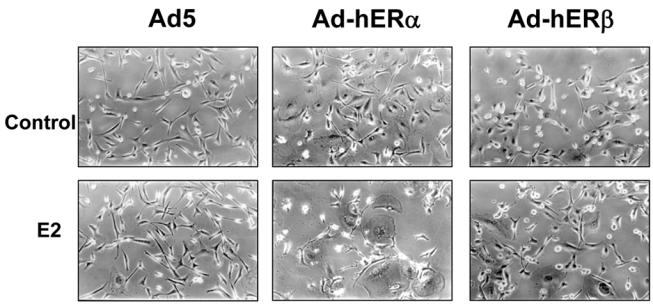
Recent studies indicate that the expression of ER beta in breast cancer is lower than in the normal breast, suggesting that ER beta could play an important role in carcinogenesis. To investigate this hypothesis, we engineered ER-negative MDA-MB-231 (human breast cancer cells) to reintroduce either ER alpha or ER beta protein with an adenoviral vector. In these cells, ER beta (as ER alpha) expression was monitored using RT-PCR and Western blot. ER beta protein was localized in the nucleus (immunocytochemistry) and able to transactivate estrogen-responsive reporter constructs in the presence of E2. ER beta and ER alpha induced the expression of several endogenous genes such as pS2, TGF alpha, or the cyclin kinase inhibitor p21 but, in contrast to ER alpha, ER beta was unable to regulate c-myc proto-oncogene expression. The pure antiestrogen ICI 164, 384 completely blocked ER alpha and ER beta estrogen-induced activities. ER beta inhibited MDA-MB-231 cell proliferation in a ligand-independent manner, whereas ER alpha inhibition of proliferation is hormone dependent. Moreover, ER beta and ER alpha decreased cell motility and invasion. Our data bring the first evidence that ER beta is an important modulator of proliferation and invasion of breast cancer cells and support the hypothesis that the loss of ER beta expression could be one of the events leading to the development of breast cancer.


Figures

Fig 1
Fig 1. Schematic representation of adenovirus construction and high infection efficiency of MDA-MB-231 cells
A. Ad-hERα and Ad-hERβ viruses were constructed as described in Materials and Methods using in vivo recombination in HEK-293 cells. The recombination occurs between the shuttle vector pACSK12-CMV5 carrying hERα or hERβ cDNAs and pJM17 adenoviral sequences. B. MDA-MB 231 cells were grown in 6-well plates and infected overnight with no virus (A), or Ad-GAL virus at MOI (multiplicity of infection) 1 (B), 10 (C), or 25 (D), 50 (E), 100 (F). β-galactosidase activity was monitored after 48 h of expression. The upper panel corresponds to a picture of the entire plate and the lower panel to a 200 fold magnification of each well.
Fig. 2
Fig. 2. Adenoviral expression of ERα and ERβ in MDA-MB-231 cells
A. MDA-MB-231 cells were infected with the non recombinant (Ad5), Ad-hERα or AdhERβ viruses at MOI 100. After 1 to 48h of treatment with 10−8M E2, hERα and hERβ expression was monitored by RT-PCR using primers located in the ligand binding domain. The PCR products have a size of 542 bp and 703 bp for ERα and ERβ respectively. B. hERα and hERβ protein expression was analysed by Western blot using hERα (αAb) or hERβ (βAb) specific antibodies. C. WCE from non infected cells (C, lane 1), non recombinant viruses (Ad5, lane 2), Ad-hERα (hERα) (lanes 3–4) or Ad-hERβ (hERβ) (lanes 5–6) infected MDA-MB 231 cells were used for gel shift assay using a consensus ERE as a probe. Supershifts were performed using specific anti hERα (αAb) (lane 4) or anti-hERβ (βAb) (lane 6) antibodies. D. MDA-MB-231 cells were infected with Ad5, Ad-hERα or Ad-hERβ (hERβ) at MOI 25 and ERα and ERβ expression was visualized by immunocytochemistry using ERα (αAb) and ERβ (βAb) specific antibodies.
Fig. 3
Fig. 3. hERα and hERβ can activate the transcription of estrogen-sensitive reporter genes
A. Empty CMV5 vector (CMV), CMV-hERα (hERα) or CMV-hERβ (hERβ) vectors were cotransfected in MDA-MB-231 cells with ERE2-TK-CAT reporter constructs and CMV-GAL internal reporter plasmid. Cells were grown for 36 h in the presence of control vehicle ethanol (C) or 10−8M E2. Results are expressed as the percentage of CAT activity in non infected cells (NI) and represent the mean ± SD (n = 5) of CAT activity after normalization for β-galactosidase activity. B. Non infected (NI) or Ad5, Ad-hERα, or Ad-hERβ infected MDA-MB-231 cells were transfected with ERE2-TK-CAT and CMV-GAL reporter constructs. Increasing MOI of Ad-hERα and Ad-hERβ viruses (0.1/1/10/100) were used. Cells were grown for 36 h in the presence of control vehicle ethanol (C) or 10−8M E2. Results are expressed as the percentage of CAT activity in non infected cells (NI) and represent the mean ± SD (n = 6) of CAT activity after normalization for β-galactosidase activity. C. MDA-MB-231 cells were infected with Ad-hERα and Ad-hERβ at MOI 100 and treated with increasing concentrations of E2. Results are expressed as the percentage of CAT activity in non infected cells (NI) and represent the mean ± SD (n = 6) of CAT activity after normalization for β-galactosidase activity. D. MDA-MB-231 cells were either transfected with empty CMV5 vector (CMV), CMV-hERα (hERα) or CMV-hERβ (hERβ) vectors or infected with Ad5, Ad-hERα or Ad-hERβ viruses along with ERE2-TK-CAT and CMV-GAL reporter constructs. Cells were grown for 36 h in the presence of control vehicle ethanol (C), 10−8M E2, ICI 164,384 (10−6M) or the combination of E2 and ICI 164, 384 (10−8 M and 10−6 M respectively). Results are expressed as the percentage of CAT activity in non infected cells (NI) and represent the mean ± SD (n = 6) of CAT activity after normalization for β-galactosidase activity.
Fig. 4
Fig. 4. Modulation of endogenous gene expression by hERα and hERβ
MDA-MB-231 cells were infected at MOI 100 with the different viruses. 24 h after infection, the E2 treatment began sequentially. All cells were harvested at the same moment following different times of E2 exposure and RNA extracted. 20 μg of total RNA were used for Northern blot and hybridized with TGFα, p21, c-myc or pS2 probes. Equal loading was checked with an RNA 28S probe. Data of a representative experiment are shown here. B. Quantification of Northern experiments after normalization by 28S RNA levels. Results are the mean ± SD (n = 3) of 3 experiments. C. The same experiments were performed in the presence of control vehicle ethanol (C), E2 (10−8M) (E), ICI 164,384 (10−6M) alone (I) or in combination (EI). Data of a representative experiment are shown here and the quantification after normalization with 28S RNA is indicated below. Results are expressed in arbitrary units of scan.
Fig. 5
Fig. 5. hERα and hERβ are able to repress the proliferation of MDA-MB-231 cells
MDA-MB-231 cells were either non infected (NI) or infected with Ad5, Ad-hERα or AdhERβ viruses at MOI 100. A. The cells were treated with ethanol vehicle or E2 (10−8M) 24 h after the beginning of the infection. Proliferation rate was determined by counting the cells at day 2, 4 and 6. Results represent the mean ± SD of 4 determinations. B. The effect of the pure antiestrogen ICI 164,384 was evaluated by treating the cells either with ICI 164,384 (10−6M) alone or in combination with E2 (10−8M). On day 4, cells were counted and results represent the mean ± SD of 3 determinations.
Fig. 6
Fig. 6. hERβ is a strong inhibitor of motility and invasion
A. MDA-MB-231 cells were infected with Ad5, Ad-hERα or Ad-hERβ viruses at MOI 100. 24 h after the beginning of the infection, the cells were then treated with ethanol (control) or E2 (10−8M). After 48h of ligand treatment, cells were scratched with a blue tip and pictured (t=0). The wound was pictured again 18h after the scratch (t=18h). Pictures of a representative assay are shown here. B. Results are shown as the % of wound filling after 18h of migration and represent the mean ± SD of 3 experiments. C. MDA-MB-231 cells were infected with Ad5, Ad-hERα or Ad-hERβ (MOI 100). Cells were plated on transwell or on control plates and treated with ethanol vehicle or E2 (10−8 M) 24h after infection. Cells which have migrated to the lower side of the filter and cells present in the control plates were counted after 36h of migration. The percentage of control migrating cells was set up to 100. Results are expressed as the percentage of control migrating cells and represent the mean ± SD of four experiments.
Fig. 7
Fig. 7. hERα and hERβ alter the morphology of MDA-MB-231 cells
MDA-MB-231 cells were infected with Ad5, Ad-hERα Ad-hERβ viruses at MOI 100. 24 h after the beginning of the infection, the cells were then treated with ethanol (control) or E2 (10−8M). After 48h of ligand treatment, cells were pictured under a phase contrast microscope.

References

    1. Gustafsson JA. Estrogen receptor beta--a new dimension in estrogen mechanism of action. J Endocrinol. 1999;163:379–83. - PubMed
    1. Russo J, Russo IH. Differentiation and breast cancer. Medicina (B Aires) 1997;57:81–91. - PubMed
    1. Haslam SZ, Counterman LJ, Nummy KA. Effects of epidermal growth factor, estrogen, and progestin on DNA synthesis in mammary cells in vivo are determined by the developmental state of the gland. J Cell Physiol. 1993;155:72–8. - PubMed
    1. Hilakivi-Clarke L, Clarke R, Lippman M. The influence of maternal diet on breast cancer risk among female offspring. Nutrition. 1999;15:392–401. - PubMed
    1. Liao DZ, Pantazis CG, Hou X, Li SA. Promotion of estrogen-induced mammary gland carcinogenesis by androgen in the male Noble rat: probable mediation by steroid receptors. Carcinogenesis. 1998;19:2173–80. - PubMed

Publication types