Comparative Study
. 2001 Sep 1;21(17):6644-56.
doi: 10.1523/JNEUROSCI.21-17-06644.2001.

Modeling circadian oscillations with interlocking positive and negative feedback loops

Affiliations
Comparative Study

Modeling circadian oscillations with interlocking positive and negative feedback loops

P Smolen et al. J Neurosci. .

Abstract

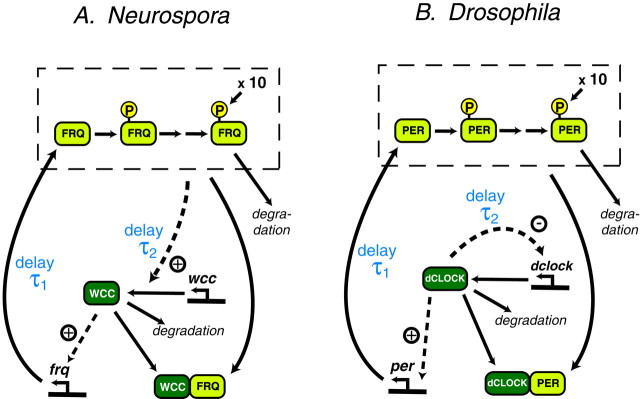
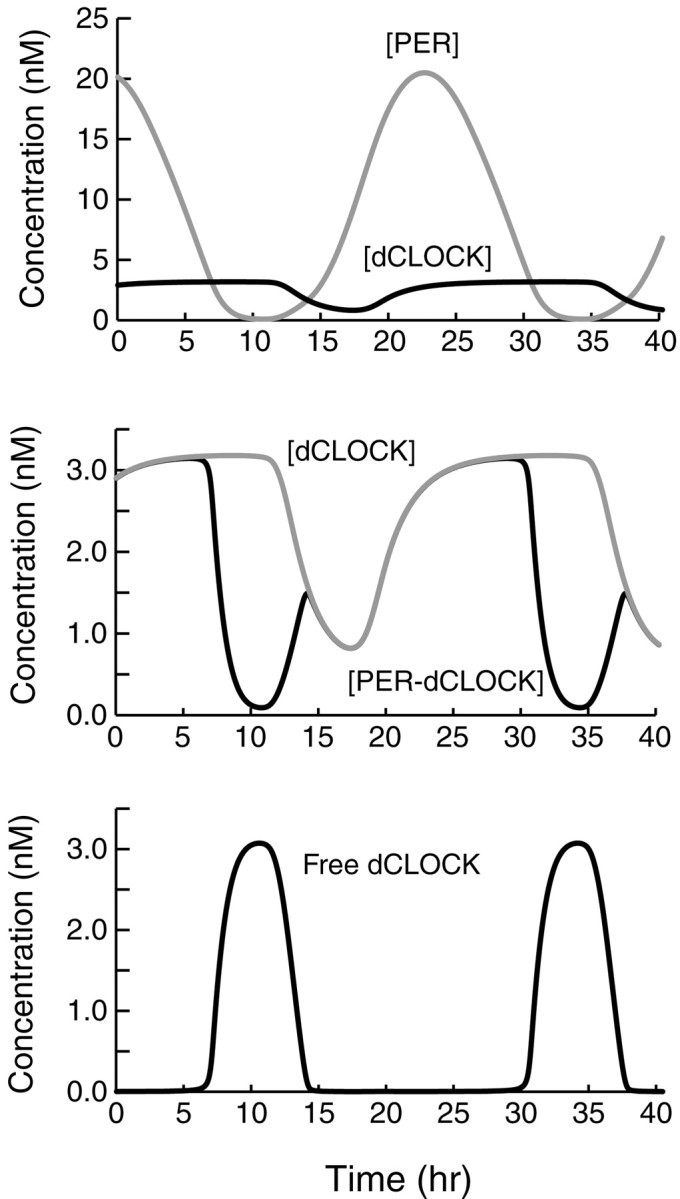
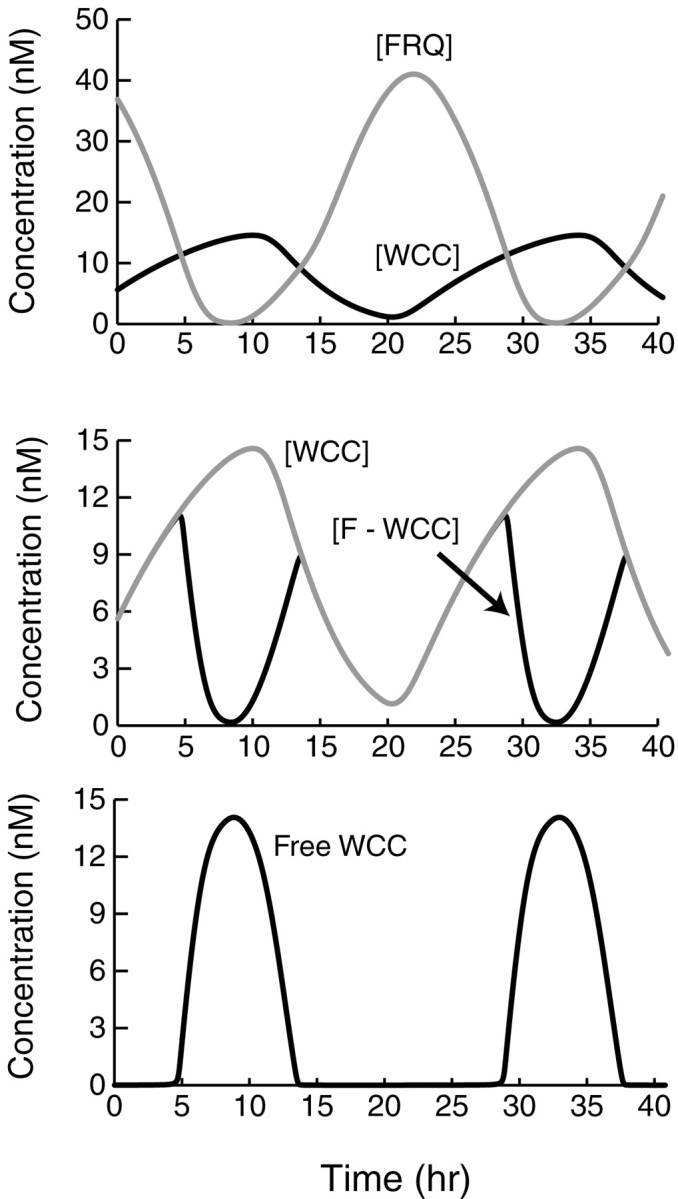
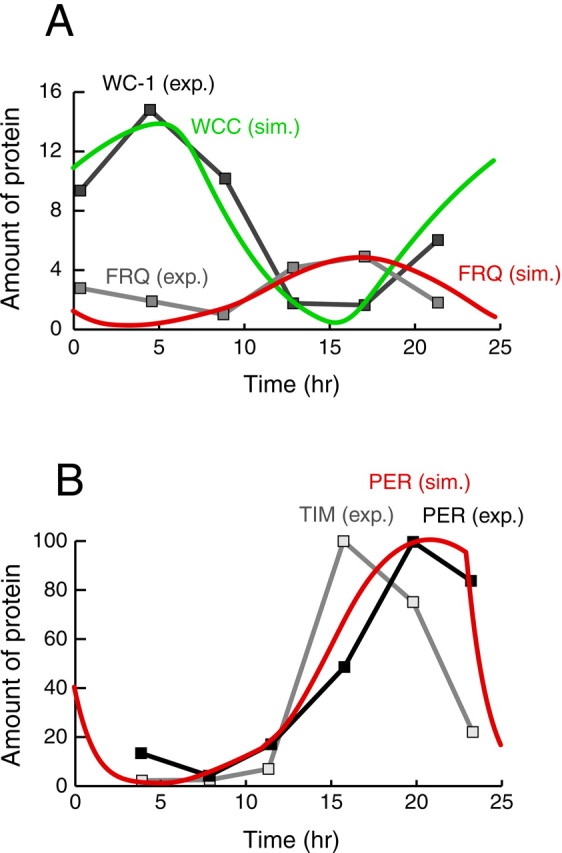
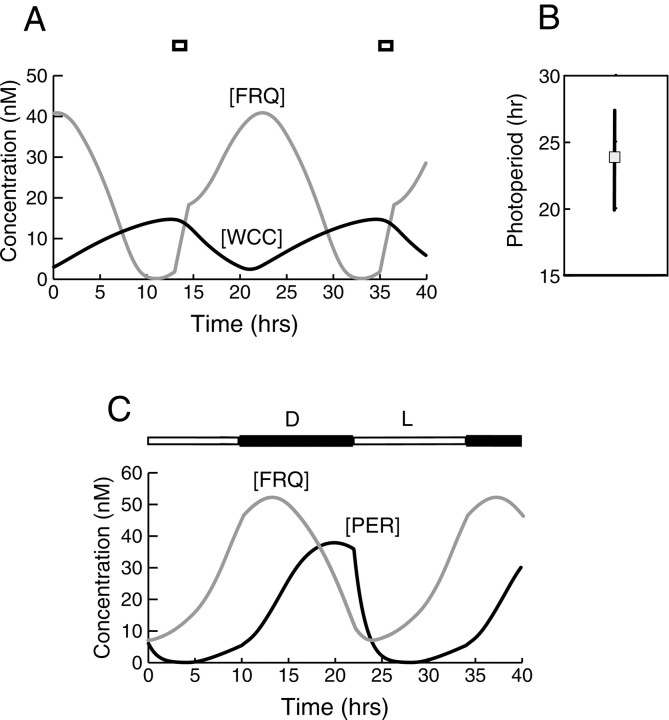
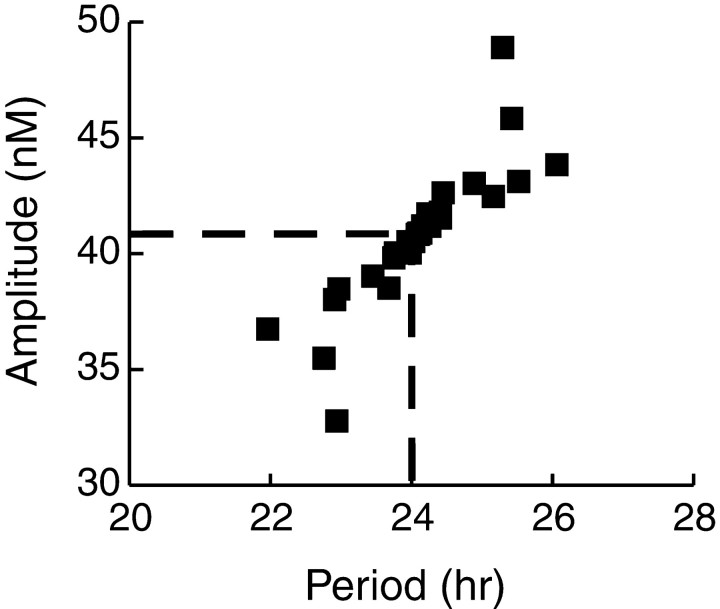
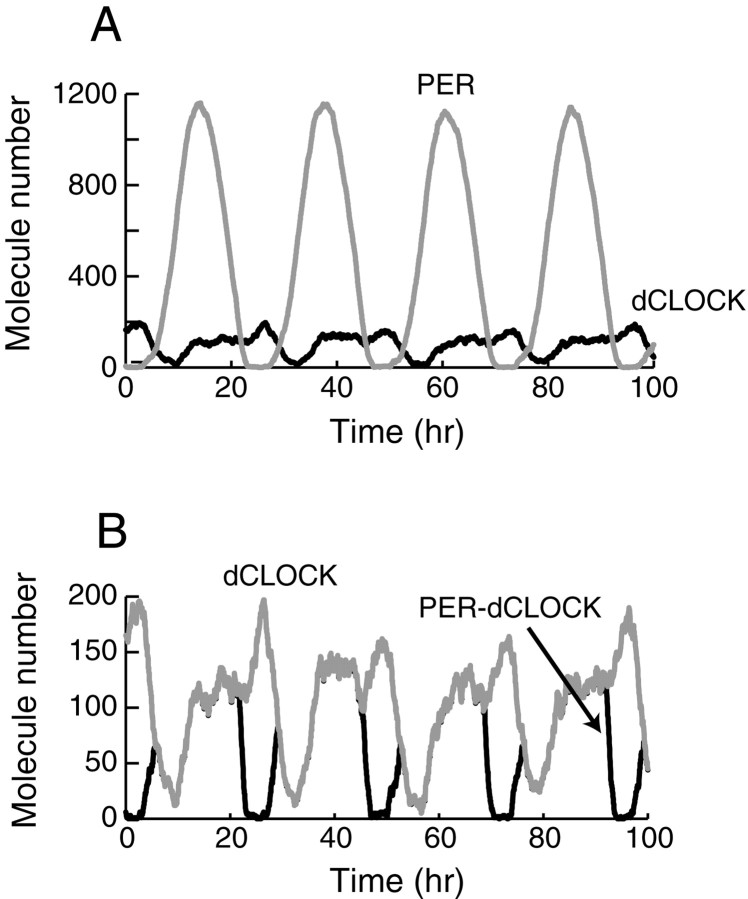
Both positive and negative feedback loops of transcriptional regulation have been proposed to be important for the generation of circadian rhythms. To test the sufficiency of the proposed mechanisms, two differential equation-based models were constructed to describe the Neurospora crassa and Drosophila melanogaster circadian oscillators. In the model of the Neurospora oscillator, FRQ suppresses frq transcription by binding to a complex of the transcriptional activators WC-1 and WC-2, thus yielding negative feedback. FRQ also activates synthesis of WC-1, which in turn activates frq transcription, yielding positive feedback. In the model of the Drosophila oscillator, PER and TIM are represented by a "lumped" variable, "PER." PER suppresses its own transcription by binding to the transcriptional regulator dCLOCK, thus yielding negative feedback. PER also binds to dCLOCK to de-repress dclock, and dCLOCK in turn activates per transcription, yielding positive feedback. Both models displayed circadian oscillations that were robust to parameter variations and to noise and that entrained to simulated light/dark cycles. Circadian oscillations were only obtained if time delays were included to represent processes not modeled in detail (e.g., transcription and translation). In both models, oscillations were preserved when positive feedback was removed.


Figures

Fig. 1.
Fig. 1.
Models for the circadian oscillators in Neurospora and Drosophila. A, Neurospora. The FRQ gene product is multiply phosphorylated before degradation. WCC represents a complex of WC-1 and WC-2. All forms of FRQ are assumed equally competent at repressingfrq transcription (dashed box) via binding to WCC. Degradation of WCC is included. The time delay τ1lies between changes in the level of WCC and resultant changes in the level of FRQ. τ2 lies between changes in the level of FRQ and resultant changes in the level of WCC. B,Drosophila. “PER” represents a combination of PER and TIM levels. PER is multiply phosphorylated before degradation. All forms of PER are assumed equally competent at repressing the transcription of per (dashed box) via binding to dCLOCK. Degradation of dCLOCK is included. The time delay τ1 lies between changes in the level of dCLOCK and resultant changes in the level of PER. τ2 lies between a change in the level of free dCLOCK and the subsequent change in the level of total dCLOCK because of regulation of clocktranscription.
Fig. 2.
Fig. 2.
Simulation of circadian oscillations inDrosophila. Subsequent to an initial transient (data not shown), the model converged to oscillations that are independent of initial conditions. The standard set of parameter values (Materials and Methods) was used. Top panel, Time courses are displayed for the level of total PER (top, gray time course) and for the level of total dCLOCK (bottom, blacktime course). Middle panel, Expanded view displaying in more detail the dynamics of dCLOCK (top, gray time course) and of the level of the PER-dCLOCK complex (blacktime course—often overlying the dCLOCK time course). Bottom panel, Time course of the level of free dCLOCK not complexed with PER.
Fig. 3.
Fig. 3.
Simulation of circadian oscillations inNeurospora. Subsequent to an initial transient, the model converged to oscillations that are independent of initial conditions. The standard set of parameter values (Materials and Methods) was used.Top panel, Time courses are displayed for the level of total FRQ (top, gray time course) and for the level of total WCC (black time course). Middle panel, Expanded view displaying in more detail the dynamics of WCC (top, gray time course) and of the level of the FRQ–WCC complex (black time course—often overlying the WCC time course). Bottom panel, Time course of the level of free WCC not complexed with FRQ.
Fig. 4.
Fig. 4.
Comparison of simulated and experimental time courses of circadian gene product levels. A,Neurospora. The simulated time course of FRQ (red) is compared with experimental time course (gray with squares). The simulated time course of WCC (green) is compared with the experimental WC-1 time course (black withsquares). Data is from Lee et al. (2000), their Figure 1B. B, Drosophila. The simulated time course of PER (red) is compared with experimental time courses of PER and TIM (black and gray). Data is from Lee et al. (1998), their Figure 2B.
Fig. 5.
Fig. 5.
Entrainment of circadian oscillations simulated by the Neurospora model (A, B) and theDrosophila model (C). A, Entrainment of the oscillations of Figure 3 by simulated light pulses. The interstimulus interval was 20 hr. Short square bars mark the effect of each light pulse, which was assumed to induce an increase in FRQ synthesis. Each 90 min increase initiates an upstroke in total FRQ. The time course of total WCC is also shown. B, Limits of entrainment for the interstimulus interval of the simulated light pulses of A. The free-running oscillation period (24.0 hr) is marked. C, Entrainment of the oscillations of theDrosophila model (Fig. 2) and the Neurosporamodel (Fig. 3) by a 12 hr light/dark cycle. The light and dark phases are indicated by the overbar. Each light phase was assumed to induce a first-order degradation of phosphorylated PER. The degradation rate constant was 0.9 hr−1. Each light phase also decreased the degradation velocity for dCLOCK, vdC, to 1.5 nm/hr. ForNeurospora, each light phase induced a constant synthesis of unphosphorylated FRQ (3.0 nm/hr).
Fig. 6.
Fig. 6.
Robustness of the Neurospora model to parameter variation. A scatter plot displays the periods and amplitudes of simulated circadian oscillations in [FRQ]. To generate these oscillations, each individual parameter in the set of standard parameter values was increased or decreased by 15%. There are 13 parameters, therefore 27 data points including the control with all parameter values standard. The location of the control data point is marked by the intersection of the horizontal andvertical dashed lines. Four additional simulations are also included. In these simulations, the widths of the time delays τ1 and τ2 were increased or decreased by 15% from their standard values.
Fig. 7.
Fig. 7.
Robustness of the Drosophila model to stochastic noise. A, Simulation of circadian oscillations. Time courses are displayed for the numbers of molecules of all forms of PER (top, gray time course) and of dCLOCK (bottom, black time course). Parameter values in the standard set were scaled to convert units from a nanomolar concentration to number of molecules. Randomness in the timing of single-molecule synthesis and degradation events was incorporated as discussed in the text. The time step was kept small (5 × 10⁻⁶ hr) so that during no time step did the probability of any given reaction occurring exceed 2%. B, Expanded view displaying oscillations of the numbers of molecules of dCLOCK (gray time course) and of the PER-dCLOCK complex (black time course).

References

    1. Bae K, Lee C, Sidote D, Chuang K, Edery I. Circadian regulation of a Drosophila homolog of the mammalian clock gene: PER and TIM function as positive regulators. Mol Cell Biol. 1998;18:6142–6151. - PMC - PubMed
    1. Bae K, Lee C, Hardin PE, Edery I. dCLOCK is present in limiting amounts and likely mediates daily interactions between the dCLOCK-CYC transcription factor and the PER-TIM complex. J Neurosci. 2000;20:1746–1753. - PMC - PubMed
    1. Barkai N, Leibler S. Circadian clocks limited by noise. Nature. 2000;403:267–268. - PubMed
    1. Crosthwaite SK, Dunlap JC, Loros JJ. Light-induced resetting of a circadian clock is mediated by a rapid increase in frequency transcript. Cell. 1995;81:1003–1012. - PubMed
    1. Crosthwaite SK, Dunlap JC, Loros JJ. Neurospora wc-1 and wc-2: transcription, photoresponses, and the origins of circadian rhythmicity. Science. 1997;276:763–769. - PubMed

Publication types

MeSH terms

LinkOut - more resources