. 2001 Sep 1;21(17):6694-705.
doi: 10.1523/JNEUROSCI.21-17-06694.2001.

Spike frequency decoding and autonomous activation of Ca2+-calmodulin-dependent protein kinase II in dorsal root ganglion neurons

Affiliations

Spike frequency decoding and autonomous activation of Ca2+-calmodulin-dependent protein kinase II in dorsal root ganglion neurons

F Eshete et al. J Neurosci. .

Abstract

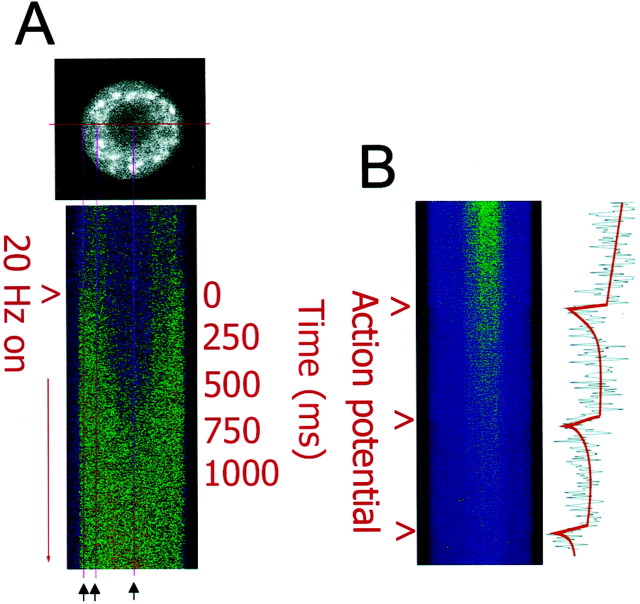
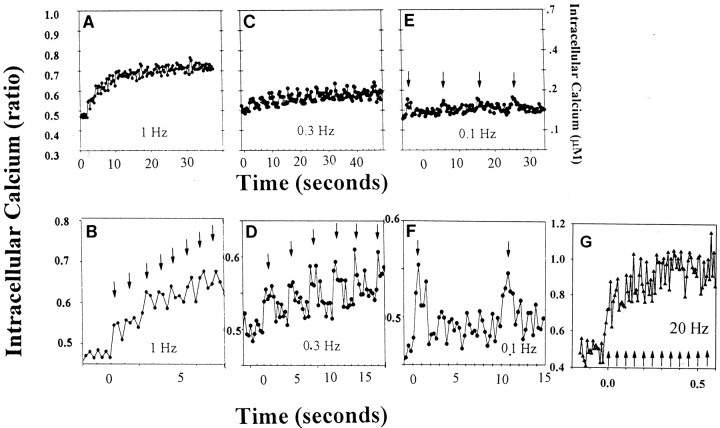
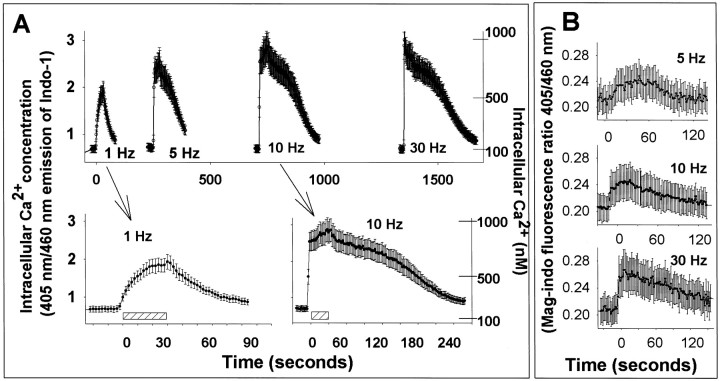
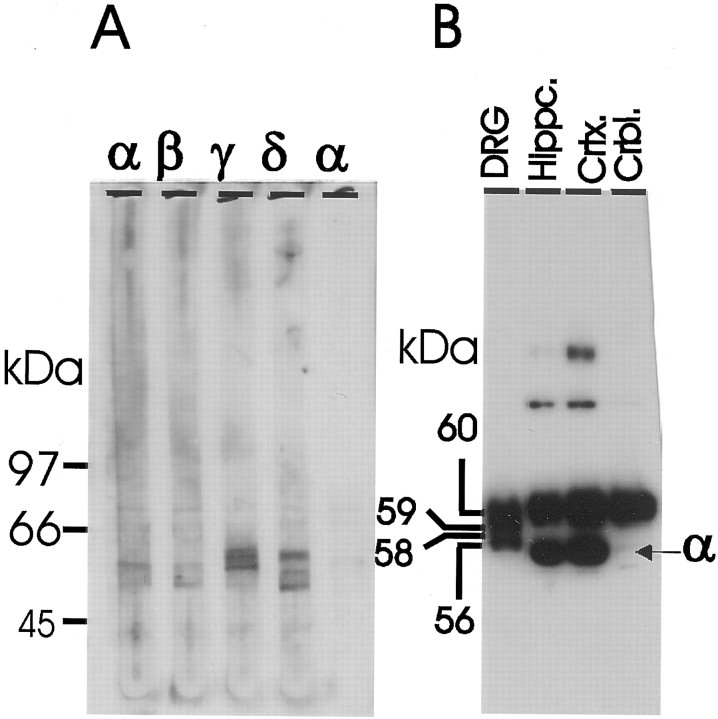
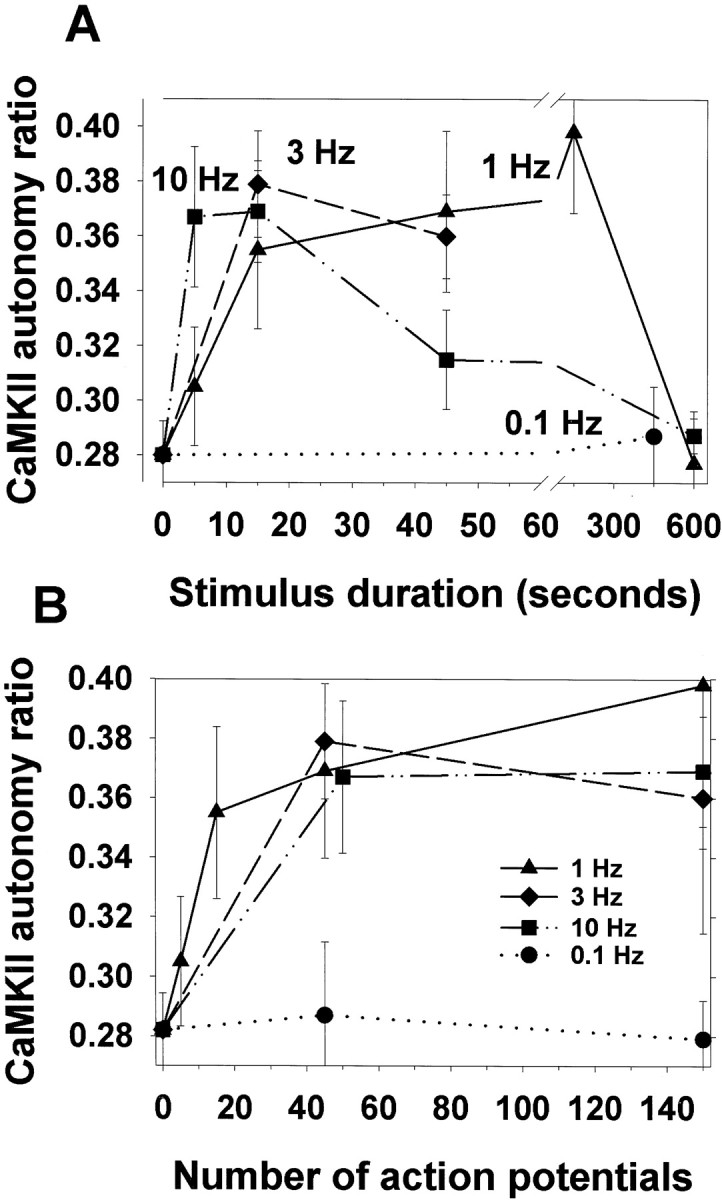
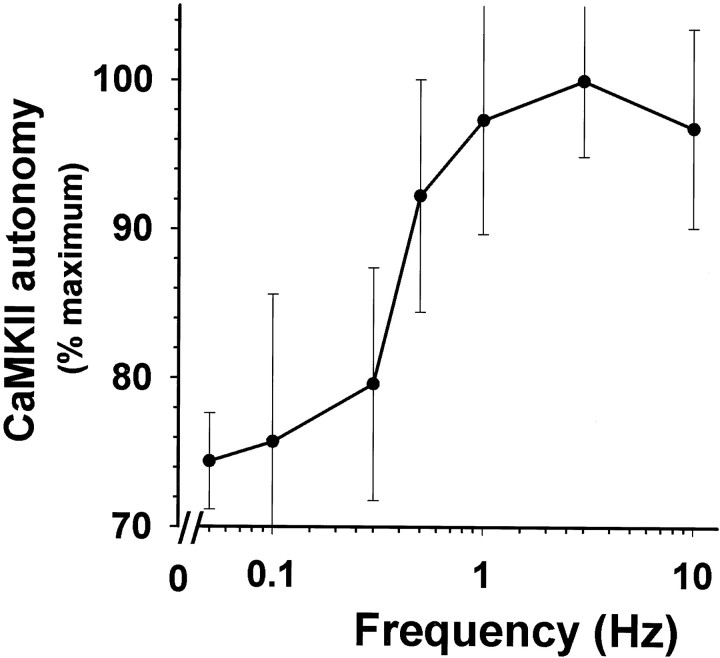
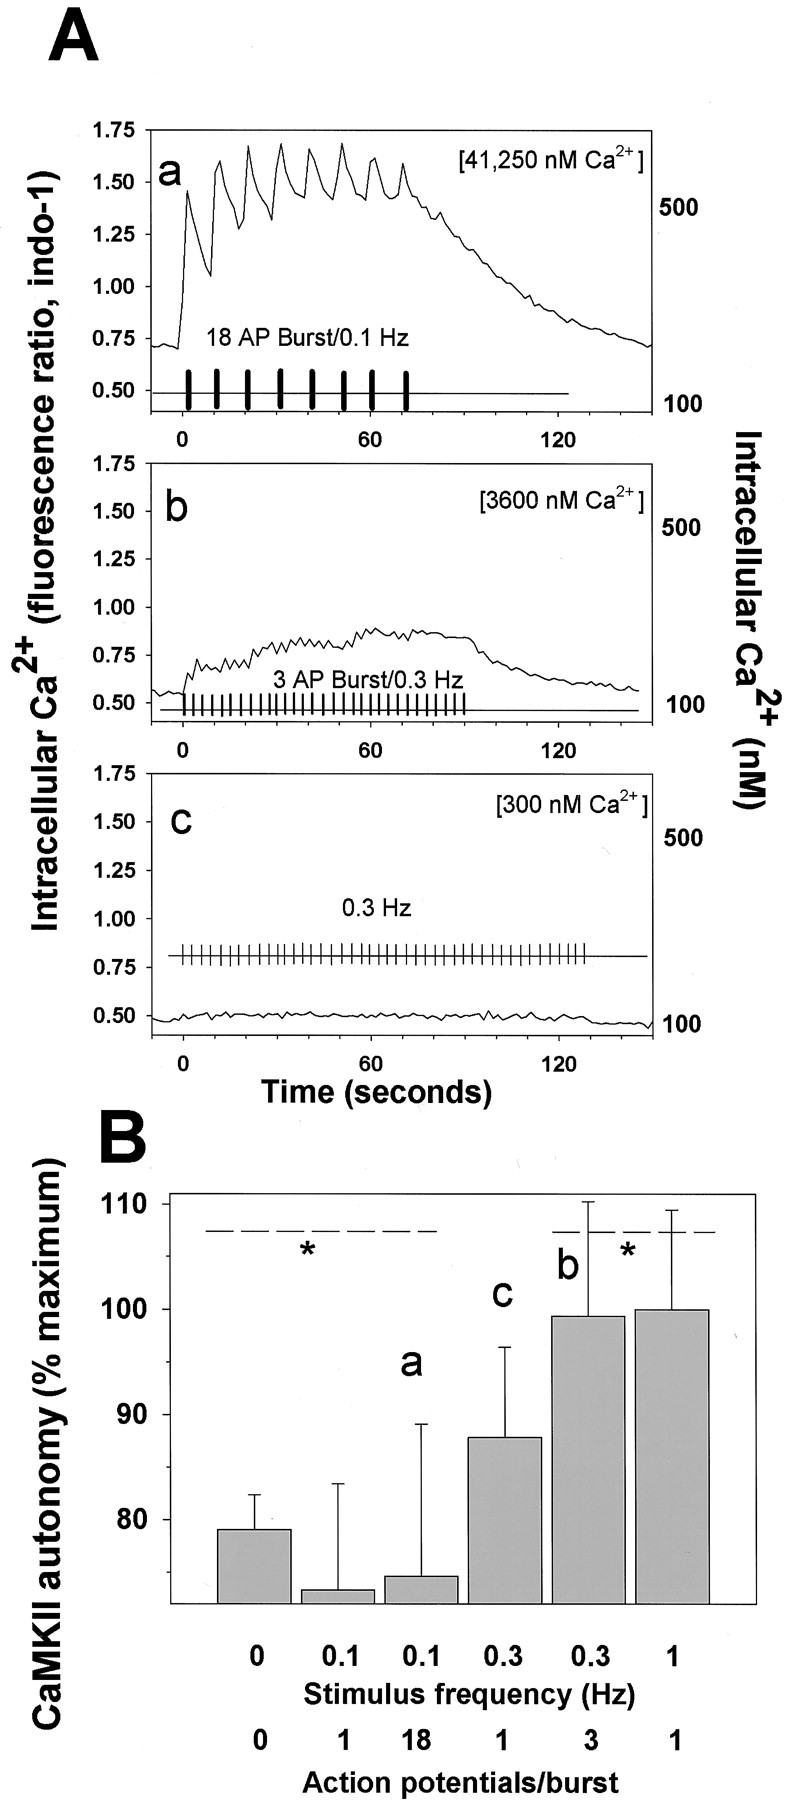
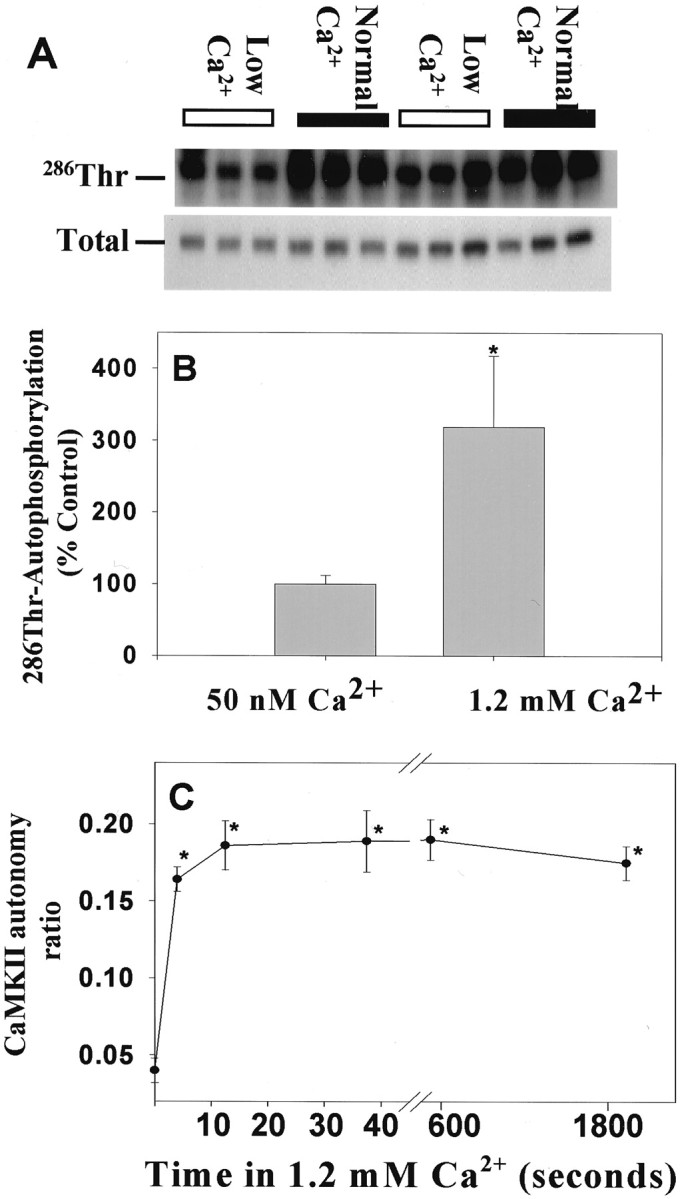
Autonomous activation of calcium-calmodulin kinase (CaMKII) has been proposed as a molecular mechanism for decoding Ca(2+) spike frequencies resulting from action potential firing, but this has not been investigated in intact neurons. This was studied in mouse DRG neurons in culture using confocal measurements of [Ca(2+)](i) and biochemical measurements of CaMKII autophosphorylation and autonomous activity. Using electrical stimulation at different frequencies, we find that CaMKII autonomous activity reached near maximal levels after approximately 45 impulses, regardless of firing frequency (1-10 Hz), and autonomous activity declined with prolonged stimulation. Frequency-dependent activation of CaMKII was limited to spike frequencies in the range of 0.1-1 Hz, despite marked increases in [Ca(2+)](i) at higher frequencies (1-30 Hz). The high levels of autonomous activity measured before stimulation and the relatively long duration of Ca(2+) spikes induced by action potentials ( approximately 300 msec) are consistent with the lower frequency range of action potential decoding by CaMKII. The high autonomous activity under basal conditions was associated with extracellular [Ca(2+)], independently from changes in [Ca(2+)](i), and unrelated to synaptic or spontaneous impulse activity. CaMKII autonomous activity in response to brief bursts of action potentials correlated better with the frequency of Ca(2+) transients than with the concentration of [Ca(2+)](i). In conclusion, CaMKII may decode frequency-modulated responses between 0.1 and 1 Hz in these neurons, but other mechanisms may be required to decode higher frequencies. Alternatively, CaMKII may mediate high-frequency responses in subcellular microdomains in which the enzyme is maintained at a low level of autonomous activity or the Ca(2+) transients have faster kinetics.


Figures

Fig. 1.
Fig. 1.
High-speed measurements of action potential-induced changes in intracellular calcium in DRG neurons using confocal microscopy in single line-scan mode. A, An optical section of a single mouse DRG neuron is shown loaded with the calcium indicator fluo-3 (black and white image). The excitation laser was scanned repeatedly through the center of the cell, and data were acquired at a rate of 8 msec/scan and displayed as a stack of sequential scans. Changes in intracellular calcium induced by action potential stimulation are shown for 250 sequential samples (2 sec total). Thus, the vertical dimension displays changes in calcium concentration with time, and the horizontal dimension displays one-dimensional spatial information on the calcium concentration along a transect across the center of the neuronal cell body. Measurements were taken in response to 0.1–30 Hz stimulation; the response to 20 Hz stimulation is shown here. Electrical stimulation caused an influx of calcium from the cell membrane and the increase in intracellular calcium propagated to the nucleus within ∼200 msec. Intracellular calcium concentration reached similar peak levels in the cytoplasm and nucleus. The three vertical magenta linesindicate the regions used for quantitative comparisons (black arrows). B, The increase in intracellular calcium concentration induced by single action potentials could be resolved with single line-scan measurements. Fluorescence intensity at 460 nm emission is shown from a DRG neuron filled with the calcium indicator indo-1. This indicator exhibits a decrease in fluorescence intensity with increasing calcium concentration at this emission wavelength. The ratio of such images at 460 and 405 nm emission wavelengths was used for quantitative analysis, as shown in Figure2G. The increase in intracellular calcium induced by an action potential lasted ∼300 msec after each action potential, and the kinetics of increase were much faster than the recovery to resting calcium levels. Scale bar, 10 μm.
Fig. 2.
Fig. 2.
Intracellular calcium transients induced by action potential stimulation of different frequencies were measured in the cell body of DRG neurons with confocal microscopy and the ratiometric calcium indicator indo-1. Individual cytoplasmic calcium spikes (B, D–F) can be seen in response to individual action potentials (arrows) elicited by electrical stimulation at different frequencies. Stimulation at higher frequencies resulted in temporal summation and an elevation in intracellular calcium level that was positively correlated with the stimulus frequency and sustained for the period of the stimulus train (A–D). In response to higher frequency stimulation, individual calcium spikes (arrows) could be resolved using single line-scan mode confocal microscopy on top of a large increase in intracellular calcium concentration (G). Note the difference in axis scaling for each graph.
Fig. 3.
Fig. 3.
The concentration dynamics of electrically evoked intracellular Ca2+ concentration varied directly with the stimulus frequency. A, Changes in cytoplasmic calcium were measured by confocal microscopy using the ratiometric fluorescent calcium indicator indo-1/AM. The rate of rise, peak, concentration, and duration of Ca2+ increase were positively correlated with stimulus frequency between 1 and 30 Hz. Data for 1 and 10 Hz are shown as insets on an expanded time scale. Results shown are mean ± SEM (n = 12 neurons). Scale bar, 30 sec stimulation. B, Similar responses are observed using the low-affinity indicator mag-indo-1, which is less sensitive to small changes in intracellular calcium.
Fig. 4.
Fig. 4.
δ and γ are the two major CaMKII isozymes expressed in cultured DRG neurons. A, Lysate from cultured neurons was resolved in 8% single well gel and immunoblotted in a manifold with polyclonal antibodies that reacted with the α, β, γ, and δ isozymes (Santa Cruz Biotechnology) and a monoclonal antibody specific to CaMKII-α (Life Technologies). The anti-CaMKII-γ antibody reacted with bands (58–60 kDa) representing the γ isoforms, whereas the antibody against CaMKII-δ recognized bands with apparent molecular mass of ∼56, 58, and 60 kDa.B, Lysates from DRG neurons, mouse hippocampus, cortex, and cerebellum were immunoblotted with antibody specific to CaMKII phosphorylated at Thr-286. In DRG lysate the phospho-specific antibody mainly reacted with bands of ∼56, 58, 59, and 60 kDa. Note the relative absence of the CaMKII-α band in both DRG neurons and mouse cerebellum.
Fig. 5.
Fig. 5.
The effect of action potential frequency and stimulus duration on autonomous activation of CaMKII. CaMKII autonomy ratio is the ratio of Ca2+-independent activity/total activity. Autonomous activity of CaMKII was measured byin vitro phosphorylation assay in homogenates of neurons electrically stimulated for 5, 15, 45, and 600 sec at 0.1, 1, 3, and 10 Hz. A, Stimulation at 1, 3, and 10 Hz for 15 sec induced statistically significant Ca2+-independent activation of CaMKII compared with unstimulated controls (p < 0.01; t test;n = 24 dishes), but the differences among responses to 1, 3, and 10 Hz were not statistically significant at 15 and 45 sec. The results shown (mean ± SEM) are from five independent experiments (ANOVA; p = 0.02; n= 150 dishes). Inactivation of the enzyme was promoted by long-duration high-frequency stimulation. The duration of stimulation required to reach maximal levels of CaMKII autonomy varied inversely with the frequency of stimulation. Stimulation at very low frequency (0.1 Hz) failed to increase CaMKII autonomous activity significantly.B, Maximal autonomous activation of CaMKII correlated with the number of action potentials delivered at these different frequencies. Within the range of 1–10 Hz, near-maximal autonomous activity was reached after ∼45 action potentials, regardless of stimulus frequency. Statistical analysis by ANOVA (p < 0.0001; n = 178), followed by Fisher's LSD multiple comparison procedure (Table 1) indicates significant increases in CaMKII autonomous activation after 45 action potentials are delivered at all frequencies tested within the range of 0.5–10 Hz, despite large differences in the stimulus duration required to reach 45 action potentials at these different frequencies (i.e., 4.5–90 sec).
Fig. 6.
Fig. 6.
Spike frequency decoding by CaMKII in DRG neurons. The frequency response curve was derived by delivering 45 action potentials at frequencies of 0.1, 0.3, 1, 3, and 10 Hz. Results are plotted as percentage of maximum stimulus-induced increase in CaMKII autonomy ratio (mean ± SEM; n = 111 dishes). CaMKII in DRG neurons showed sensitivity to low frequencies of action potentials <1 Hz, but higher frequency stimulation produced similar levels of CaMKII autonomous activation, despite marked differences in intracellular Ca2+ (compare Fig. 3). The mean ratio of Ca2+-independent activity/total activity in unstimulated neurons (0 Hz) was 0.28 ± 0.068 (n = 36 dishes).
Fig. 7.
Fig. 7.
CaMKII autonomous activity in response to periodic bursts of action potentials correlates with the frequency of calcium pulses rather than concentration of intracellular calcium.A, Intracellular calcium transients were measured by confocal microscopy in neurons stimulated in three patterns: 18 action potential bursts (at 10 Hz) repeated at 10 sec intervals (0.1 Hz) (a); three action potential bursts (at 10 Hz) repeated at 3 sec intervals (0.3 Hz) (b); and single action potentials delivered at 3 sec intervals (0.3 Hz) (c). The net increase in [Ca2+]i during the entire stimulus period with each stimulus pattern is given in brackets in the top right of each plot (calcium concentration time integral, nanomolar con- centration). The average calcium response of the same five neurons is plotted in response to each stimulus.B, Comparing CaMKII autonomous activity in response to single action potentials and repetitive bursts of action potentials at different frequencies. Stimulation at low frequency failed to increase CaMKII autonomous activity regardless of whether single action potentials or bursts of 18 action potentials were delivered. The increase in [Ca2+]i produced by these different stimuli (A, a–c) did not correlate with CaMKII autonomous activation, suggesting that the frequency of calcium transients was more critical than the calcium levels. CaMKII autonomy is plotted as the percentage of maximal stimulus-induced increase in ratio of calcium-independent–calcium-dependent activity, which averages 0.28 ± 0.068 in unstimulated neurons; p < 0.01; ANOVA; n = 96; *values outside the indicated range are significantly different by Fisher's LSD multiple comparison test.
Fig. 8.
Fig. 8.
Autophosphorylation of CaMKII at Thr-286 was reduced in DRG neurons in low extracellular concentration of Ca2+. A, DRG neurons were changed to low calcium (50 nm Ca2+-PSS) for 1 hr before switching to normal calcium concentration (1.2 mmCa2+-PSS) for 45 sec. Lysates were analyzed by immunoblotting with an antibody recognizing the phospho-Thr-286 CaMKII. Each lane represents data from a single neuronal culture. Two replicate experiments of three cultures per treatment (12 cultures total) are shown, in which neurons were either incubated in 50 nm Ca2+ for 1 hr (Low Ca2+) or switched from this low-Ca2+ solution to 1.2 mmCa2+ (Normal Ca2+) for 45 sec. The same volume of lysate was analyzed for both phospho- and total-CaMKII immunoreactivity. B shows the normalized relative immunoreactivity of Thr-286 CaMKII in low and normal [Ca2+]. Data are mean ± SEM (n = 8 dishes). *Significantly different from neurons equilibrated at low [Ca2+]o(p = 0.0004; t test).C, The autonomous activation of CaMKII is rapid and persistent in DRG neurons equilibrated in low [Ca2+]o and switched into 1.2 mm Ca2+. Cultured neurons exposed to 50 nm Ca2+ for 1 hr were switched to 1.2 mm Ca2+-PSS for 5, 15, and 45 sec and 10 and 30 min before lysis. Data are mean ± SEM from two separate experiments of equal sample size. Autonomous activity ratio (Ca2+-independent/total) was calculated for each dish. *The level of activation is significantly different from neurons equilibrated in 50 nmCa2+-PSS (p = 0.001; ANOVA; n = 36 dishes). Note that changes in extracellular calcium concentration did not alter intracellular calcium levels measurably (Fig. 9).
Fig. 9.
Fig. 9.
Changes in concentration of extracellular Ca2+ that affect CaMKII autophosphorylation produced no detectable change in intracellular concentration in DRG neurons.A, Action potentials induced by brief electrical stimulation (10 Hz) caused a large increase in intracellular calcium as measured with fluo-3 fluorescence in time-lapse confocal microscopy. After intracellular calcium concentration recovered to basal levels, the extracellular calcium concentration was lowered from 1.2 mm Ca2+ to 50 nmCa2+ using a rapid bath perfusion system (Low Ca2+). The intracellular calcium concentration was not altered significantly (a), and remained constant over the next 25 min (b). Electrical stimulation produced no change in intracellular calcium in low calcium conditions (b, inset, 10 Hz), indicating that the change to low extracellular calcium concentration by perfusion of 50 nm Ca2+ solution had been effective. After then returning extracellular calcium concentration to 1.2 mm (Ca2+stim), intracellular calcium concentration remained constant for the next 40 min (b, inset). Calcium ionophore A23187 applied at the end of the experiment (*) caused a large increase in intracellular calcium, demonstrating the efficacy of the measurement technique. B, Similar results were obtained using the ratiometric calcium indicator indo-1, to correct for decreasing fluorescence caused by photobleaching in prolonged recordings and to obtain a quantitative estimate of changes in intracellular calcium. Brief 10 Hz stimulation or depolarization with 90 mm KCl caused large increases in intracellular Ca2+ concentration, but intracellular Ca2+ levels remained constant after lowering extracellular Ca2+ concentration from 1.2 mm to 50 nm or increasing extracellular Ca2+ from 50 nm to 1.2 mm (Ca2+stim). Results shown are mean ± SEM;n = 8 neurons in A and 13 neurons inB. Although extracellular Ca2+stimulation did not alter intracellular calcium measurably, the changes in extracellular calcium caused large changes in autonomous activity of CaMKII (Fig. 8).

Similar articles

Cited by

References

    1. Bayer K-U, Lohler J, Schulman H, Harbers K. Developmental expression of the CaM kinase II isoforms: ubiquitous γ- and δ-CaM kinase II are the early isoforms and most abundant in the developing nervous system. Mol Brain Res. 1999;70:147–154. - PubMed
    1. Brocke L, Chiang LW, Wagner PD, Schulman H. Functional implications of the subunit composition of neuronal CaM Kinase II. J Biol Chem. 1999;274:22713–22722. - PubMed
    1. Colegrove SL, Albrecth MA, Friel DD. Quantitative analysis of mitochondrial C12+ uptake and release pathways in sympathetic neurons. Reconstruction of the recovery after depolarization-evoked [Ca2+]i elevations. J Gen Physiol. 2000;115:347–350. - PMC - PubMed
    1. Coomber CJ. Site-selective autophosphorylation of Ca2+/calmodulin-dependence protein kinase II as a synaptic encoding mechanism. Neural Comput. 1998;10:1653–1678. - PubMed
    1. De Koninck P, Schulman H. Sensitivity of CaMKII to the frequency of Ca2+ oscillations. Science. 1998;279:227–230. - PubMed

Publication types

MeSH terms

LinkOut - more resources