

Alterations induced by chronic stress in lymphocyte subsets of blood and primary and secondary immune organs of mice
- PMID: 11518541
- PMCID: PMC37547
- DOI: 10.1186/1471-2172-2-7
Alterations induced by chronic stress in lymphocyte subsets of blood and primary and secondary immune organs of mice
Abstract
Background: The immune system is particularly sensitive to stress. Although acute stress generally has positive effects, chronic stress typically provokes immunosuppression. The elucidation of the mechanisms involved in immunosuppression are of interest for the design of therapeutic approaches to avoid the appearance of stress disorders. This study aimed to investigate chronic stress-induced alterations on lymphocyte subset distribution and percentages. The experiments were performed with C57BL/6 mice subjected to chronic immobilization stress.
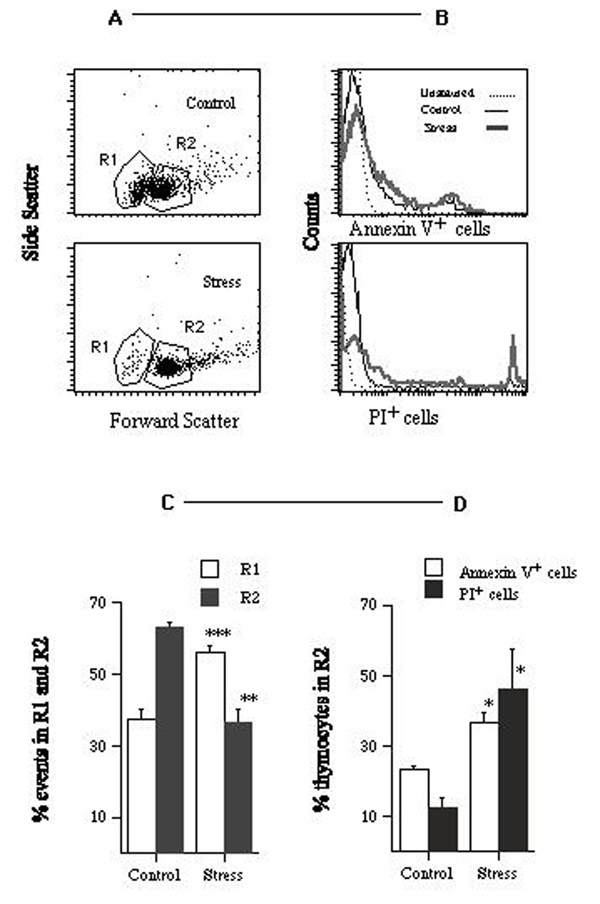
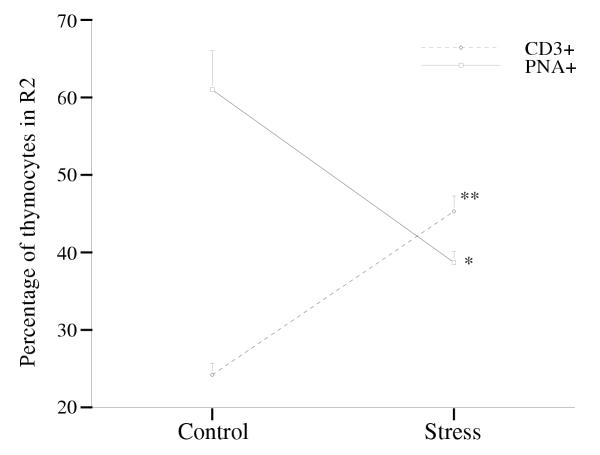
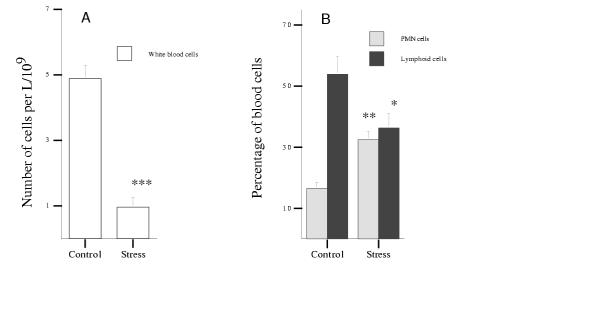
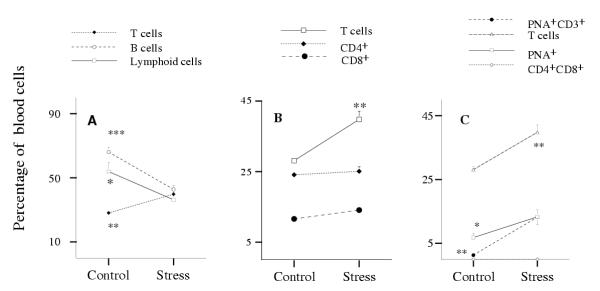
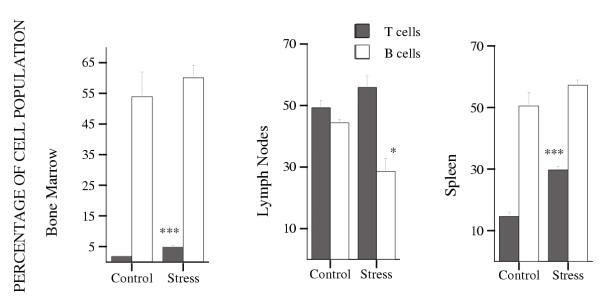
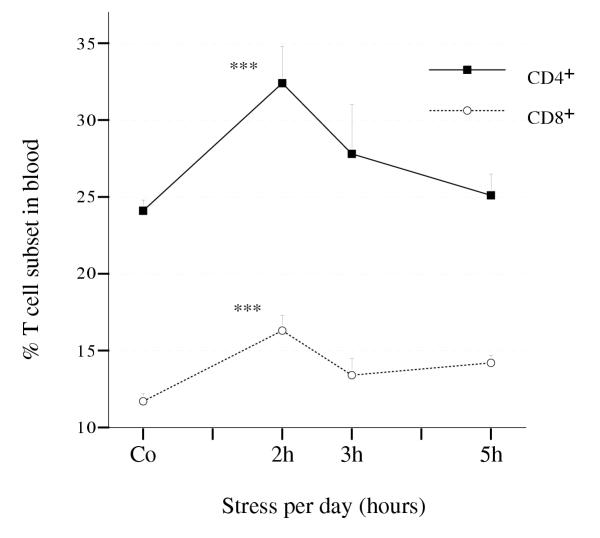
Results: Stress caused a marked increase in apoptosis inside the thymus, and a reduction in the total number of thymocytes. Furthermore, the proportion of immature thymocytes declined significantly suggesting that the increased apoptosis mainly affected cells of immature phenotype. In blood, the total number of lymphocytes diminished but not all lymphocyte populations showed the same tendency: while the relative proportion of B cells declined slightly, the relative proportion of circulating CD3+ cells, and particularly some T cell subsets showing an immature phenotype (CD3+PNA+), increased under stress. The spleen and lymph nodes show a marked reduction in cellularity, but the relative proportion of T cells increased, while no change or only a slight reduction was observed in the relative proportion of B cells. Similarly, the relative proportion of T cells increased in bone marrow.
Conclusions: Detailed data on the alterations of lymphoid cell subsets occurring under immobilization stress, both in the bloodstream and in different lymphoid tissues, are obtained. In general, T cells are more affected than B cells and, in particular, a marked increase in the percentage of a subset of circulating PNA+CD3+ T cells is observed.
Figures
References
-
- Haynes BF, Denning SM, Le PT, Singer KH. Human intrathymic T cell differentiation. Semin Immunol. 1990;2:67–77. - PubMed
-
- Sinkora M, Sinkora J, Rehakova Z, Butler JE. Early ontogeny of thymocytes in pigs: sequential colonization of the thymus by T cell progenitors. J Immunol. 2000;165:1832–1839. - PubMed
-
- Scollay R, Smith J, Stauffer V. Dynamics of early T cells: prothymocyte migration and proliferation in the adult mouse thymus. Immunol Rev. 1986;91:129–157. - PubMed
MeSH terms
LinkOut - more resources
Full Text Sources
