. 2001 Sep-Oct;8(5):443-59.
doi: 10.1136/jamia.2001.0080443.

An integrated software suite for surface-based analyses of cerebral cortex

Collaborators, Affiliations

An integrated software suite for surface-based analyses of cerebral cortex

D C Van Essen et al. J Am Med Inform Assoc. 2001 Sep-Oct.

Abstract

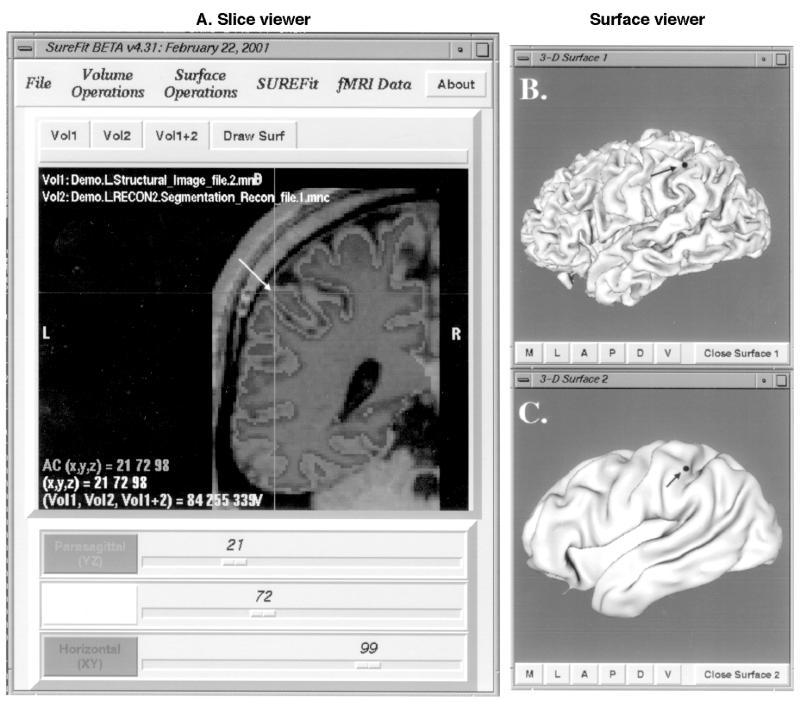
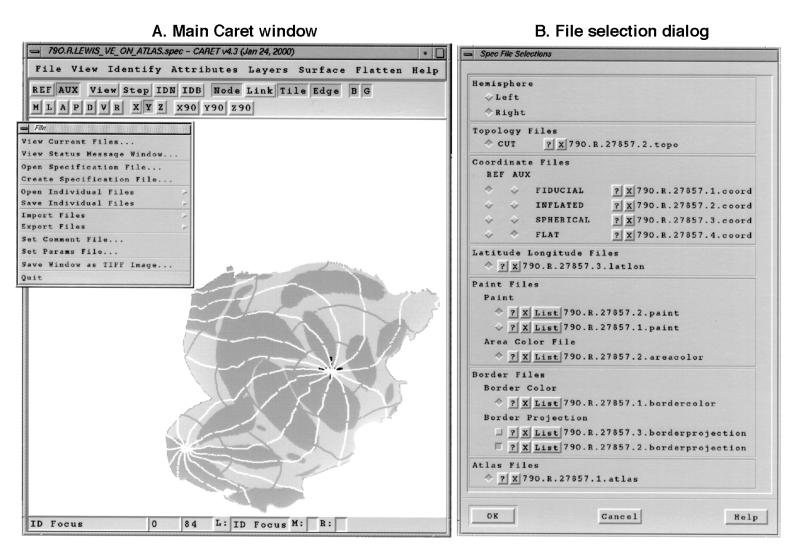
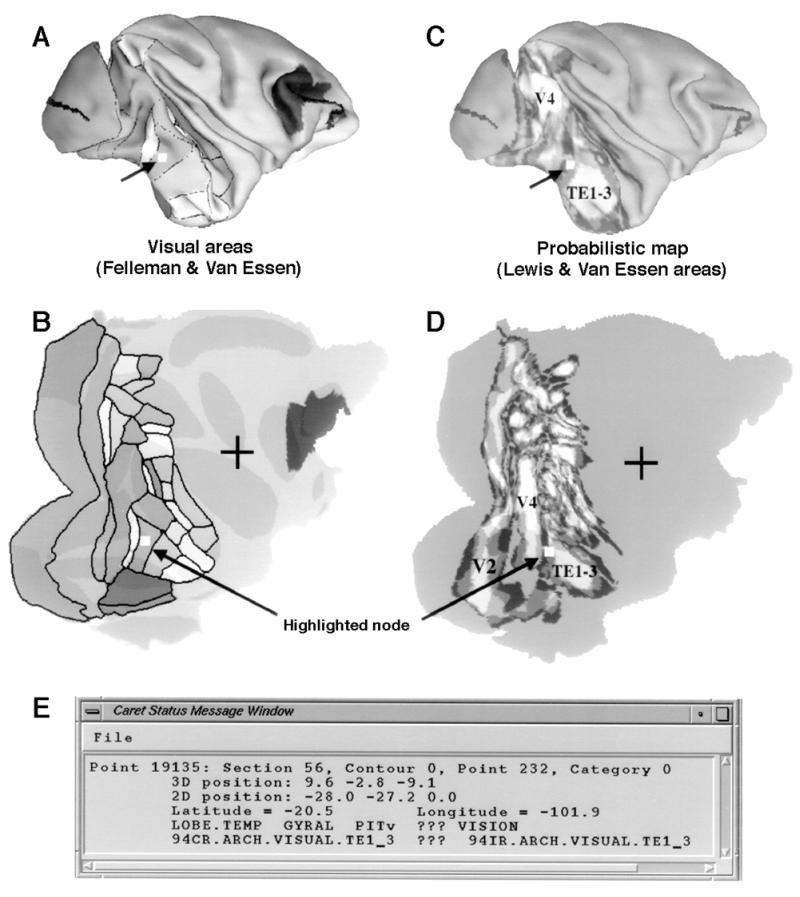
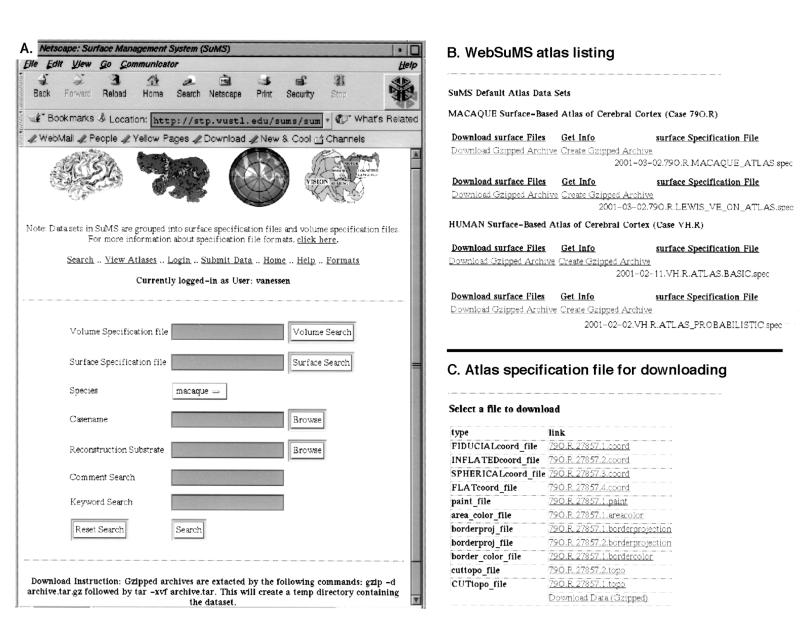
The authors describe and illustrate an integrated trio of software programs for carrying out surface-based analyses of cerebral cortex. The first component of this trio, SureFit (Surface Reconstruction by Filtering and Intensity Transformations), is used primarily for cortical segmentation, volume visualization, surface generation, and the mapping of functional neuroimaging data onto surfaces. The second component, Caret (Computerized Anatomical Reconstruction and Editing Tool Kit), provides a wide range of surface visualization and analysis options as well as capabilities for surface flattening, surface-based deformation, and other surface manipulations. The third component, SuMS (Surface Management System), is a database and associated user interface for surface-related data. It provides for efficient insertion, searching, and extraction of surface and volume data from the database.


Figures

Figure 1
Figure 1
Processing stages in surface-based analysis. The upper portion shows the primary stages involved in generating an initial (“raw”) surface reconstruction from a primary source of structural data. Entries on the upper left indicate stages associated with extracting a cortical segmentation from volumetric structural data. Entries on the upper right indicate analogous stages associated with extracting and aligning section contours to represent cortical shape. The lower half shows transformations from the raw cortical surface to various alternative configurations of the same surface as well as deformations to a surface-based atlas.
Figure 2
Figure 2
Illustrative data set taken through the processing sequence illustrated in Figure 1▶. A, Coronal slice through a structural MRI volume of human left hemisphere. B, Cortical segmentation through the same coronal slice, generated using the SureFit method. C, The fiducial surface generated from this segmentation. D, Functional MRI (fMRI) data overlaid on the same structural MRI data shown in A, generated in a behavioral paradigm involving eye movements. E, The fMRI data painted on the cortical surface and displayed in white and light shades. F, The same fMRI data displayed on an inflated surface, with cortical geography (sulcal regions) shown in darker shades. G, Spherical map that shows fMRI data, cortical geography, and latitude-longitude isocontours. H, The same data shown on a cortical flat map. I, Spherical map of the Visible Man atlas, with fMRI data deformed to the atlas. J,.Flat map of the Visible Man atlas that includes cortical geography, deformed fMRI data projected from the sphere to the flat map, and boundaries of Brodmann's architectonic areas as mapped by Drury et al. The data for the individual case can be downloaded from SuMS via a hyperlink connection to http://stp.wustl.edu/sums/sums.cgi?specfile=Demo.L.full.jamia.Fig2.spec.
Figure 3
Figure 3
Volume and surface visualization in SureFit. A, The main SureFit window, which can be used as a general volumetric slice viewer and in connection with the SureFit segmentation process. B, Fiducial surface reconstruction displayed in the SureFit surface viewer. C, Inflated cortical surface displayed simultaneously in a second surface viewer.
Figure 4
Figure 4
Schematic representation of key structural features of cerebral cortex that are relevant to the SureFit segmentation algorithm. The cortical sheet is approximately constant in thickness and adjoins white matter on its inner boundary. Its outer (pial) boundary adjoins cerebrospinal fluid in gyral regions and oppositely oriented cortical sheet in sulcal regions.
Figure 5
Figure 5
(Opposite) Stages of cortical segmentation in SureFit. A, Coronal slice through occipital cortex in a human structural MRI volume. B, Intensity histogram for the image volume shown in A. Arrows indicate values for parameters used to generate intensity-based probabilistic maps of cortical regions or boundaries. C, An intensity-based probabilistic map of the inner boundary. This is based on a Gaussian intensity transformation:formula image and formula imagewhere I(n) is the intensity value for the th voxel, Ipeak is an estimate of the most likely intensity value for the tissue type or boundary, and the standard deviations σlow and σhigh are related to the noisiness of the image data. D, Map of the magnitude of the intensity gradient. E, The composite inner boundary map. One component of this composite map is the intensity-based map of the inner boundary (C). Another component is derived by determining where the intensity gradient is intermediate in magnitude (made explicitly by a Gaussian intensity transformation analogous to that in C) and pointed opposite to the gradient of a probabilistic map of matter (not shown; also based on a Gaussian intensity transformation). A third component selectively emphasizes regions near the crowns of gyri (where the underlying white matter is notably thin) by testing for regions containing two gradient-based inner-boundary domains that are in close proximity but pointed in opposite directions. F, Intensity-based map of the outer boundary. G, Map of the outer boundary in sulcal regions, based on evidence for two inner boundaries that are pointed in opposite directions and are each displaced about one cortical thickness (3 mm for human cortex) from the voxel being tested. H, The composite outer boundary map, derived from the intensity-based outer boundary map (F), the sulcal outer boundary (G), and gradient-based cues analogous to those used for the inner boundary. I, Binary map of cerebral white matter, based on thresholding the intensity volume and removing various noncerebral structures. J, A map of positions along the radial axis, generated by blurring both the inner and outer boundary maps, normalizing the output by dividing the difference by the sum at each voxel, and assigning a maximal value to contained in the interior of cerebral white matter (i.e., in an eroded version of the image shown in I). K, The initial segmented volume obtained by thresholding the radial position map. L, The initial segmented volume superimposed on the original intensity volume.
Figure 6
Figure 6
A, The main Caret screen, showing a cortical flat map from the macaque surface-based atlas. The tear-off menu on the upper left shows options available in the File menu. B, The File Selection dialog after a specification file for the macaque surface-based atlas has been selected. Files listed in the specification file are displayed in appropriate categories. Default file sections in each category are indicated by depressed buttons on the left. The currently loaded border file or border projection file can be toggled on and off using the “B” (Borders) toggle button. Selection of the geography (“G”) toggle button colors nodes according to the node identities and the color assignments contained in the currently loaded “area color file.”
Figure 7
Figure 7
Visualization and identification of multiple data types simultaneously loaded into Caret. A, The fiducial configuration of the macaque surface-based atlas, showing visual areas in the Felleman and Van Essen partitioning scheme. B, Flat map showing the same set of visual areas. C, Probabilistic map of visual areas in the Lewis and Van Essen partitioning scheme, shown on the fiducial configuration. Brighter shading indicates a higher fraction of cases associated with the same visual area (which appear in color on the Caret screen). D, Flat map showing the Lewis and Van Essen areas. In A through D, a node in one of the temporal lobe areas was highlighted (white square, which appears green on the Caret screen). E, The pop-up Caret status message window, displaying information about the highlighted node. The three-dimensional position represents the coordinates of the nodes in the REF configuration (here, the fiducial surface). The two-dimensional position represents the coordinates in the AUX configuration (here, the flat map in Cartesian standard coordinates with the origin at the ventral tip of the central sulcus). The latitude (−20.5 ) and longitude (−101.9 ) represent values in the currently loaded latitude-longitude file, which was previously generated using a spherical map with areal distortions minimized and oriented to the spherical standard coordinate frame (ventral tip of the central sulcus at the lateral pole). The fourth row displays information from the currently loaded paint file (LOBE.TEMP signifying the temporal lobe; “???” signifying no entry for that column of the five-column paint file). The last row displays information from the currently loaded atlas file. This contains five entries, only three of which are shown here, indicating that the selected node is an architectonic area TE1-3 in some but not all cases from the atlas file data set. The data sets illustrated here can be downloaded for viewing in Caret from http://stp.wustl.edu/sums/sums.cgi?specfile=2001-03-02.79O.R.LEWIS_VE_ON_ATLAS.spec.
Figure 8
Figure 8
Screen displays using WebSuMS to access the SuMS database. A, The WebSuMS search page (http://stp.wustl.edu/sums/sums.cgi) can be used to identify specification files in the SuMS database that meet whatever search criteria are entered by the user. This can be a partial or complete name of a particular volume or surface specification file (top rows) or a particular case from the currently selected species (macaque in this example) plus the option of adding criteria such as key words in the comment section of any data file or in the data fields of paint files, border files, and cell files contained in SuMS. B, The current listing of surface-based atlas specification files obtained by selecting the “View Atlases” menu button. C, The specification file obtained by selecting one of the macaque atlases (LEWIS_VE_ON_ATLAS.spec). The entire set of files can be downloaded as a group, then viewed in Caret after being uncompressed. For WebSuMS, the user interfaces with the SuMS Web Server via HTTP (HyperText Transfer Protocol) using standard HTML forms and scripts based on CGI (Common Gateway Interface). For the SuMS Client, Remote Method Invocation (developed by Sun Microsystems) is used as the interface with a JDBC (Java Database Connectivity) driver. One Java application or applet (the SuMS client in this context) can call the methods of another Java application (the SuMS server) running on a different host machine.

Comment in

References

    1. Daniel PM, Whitteridge D. The representation of the visual field on the cerebral cortex in monkeys. J Physiol (Paris). 1961;159:203–21. - PMC - PubMed
    1. Gattass R, Gross CG. Visual topography of striate projection zone (MT) in posterior superior temporal sulcus of the macaque. J Neurophysiol. 1981;46:621–38. - PubMed
    1. Van Essen DC, Drury HA, Anderson CH. An automated method for reconstructing complex surfaces, including the cerebral cortex. Soc Neurosci Abstr. 1999;25:1929.
    1. Dale AM, Fischl B, Sereno MI. Cortical surface-based analysis, part I: Segmentation and surface reconstruction. NeuroImage. 1999;9:179–94. - PubMed
    1. Goebel R, Khorram-Sefat D, Muckli L, Hacker H, Singer W. Functional imaging of mirror and inverse reading reveals separate coactivated networks for oculomotion and spatial transformations. NeuroReport. 1998;9:713–9. - PubMed

Publication types