. 2001 Sep 1;29(17):3495-505.
doi: 10.1093/nar/29.17.3495.

An enhancer element 6 kb upstream of the mouse HNF4alpha1 promoter is activated by glucocorticoids and liver-enriched transcription factors

Affiliations

An enhancer element 6 kb upstream of the mouse HNF4alpha1 promoter is activated by glucocorticoids and liver-enriched transcription factors

A Bailly et al. Nucleic Acids Res. .

Abstract

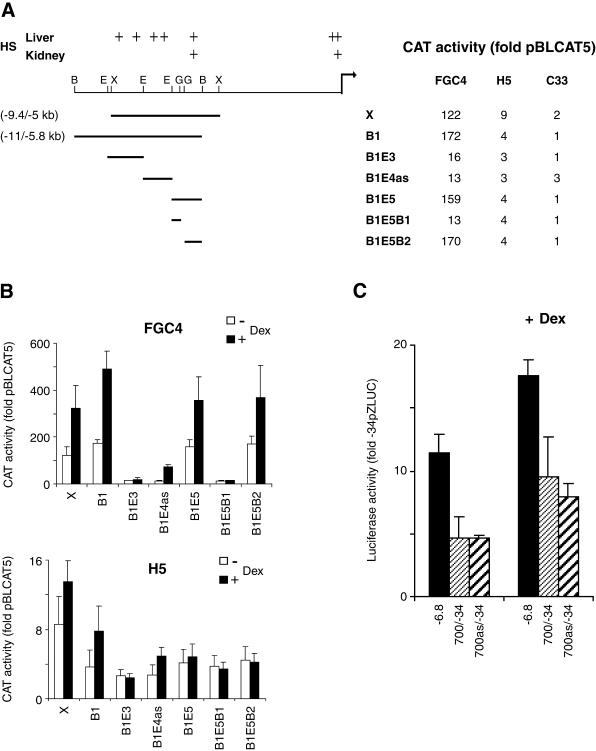
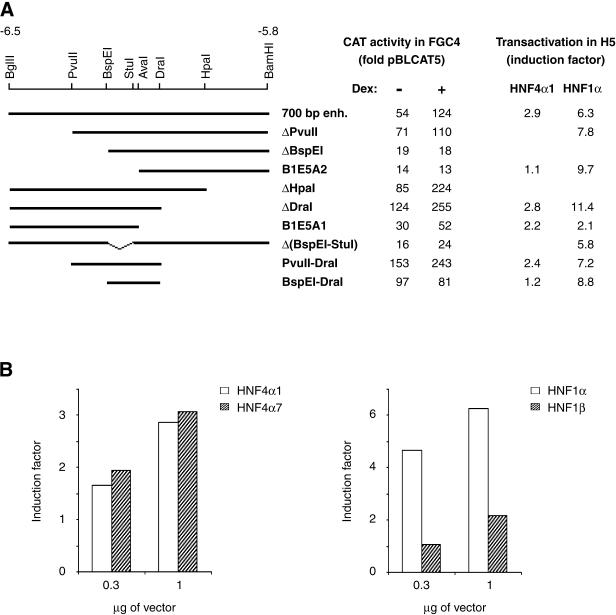
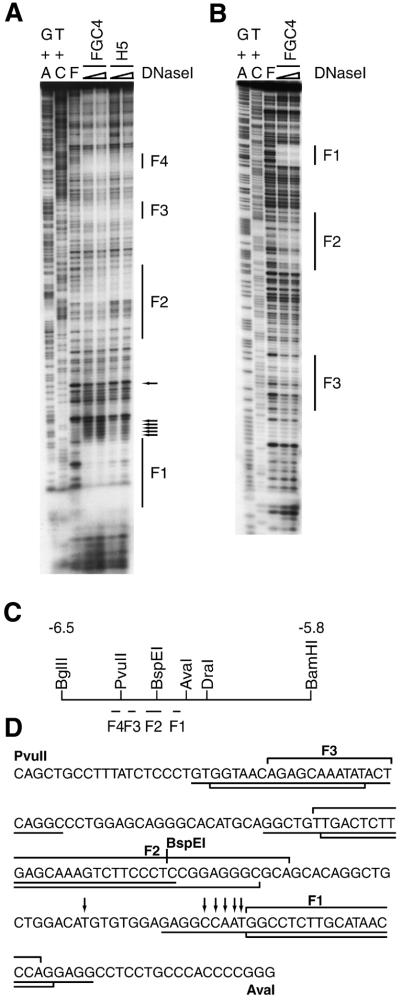
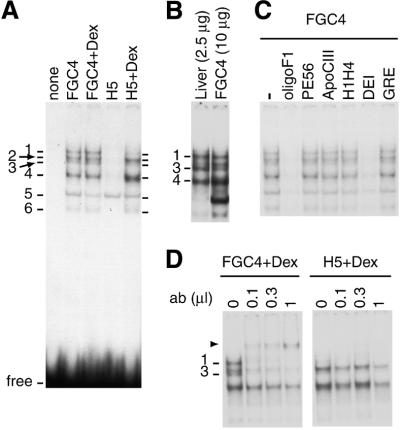
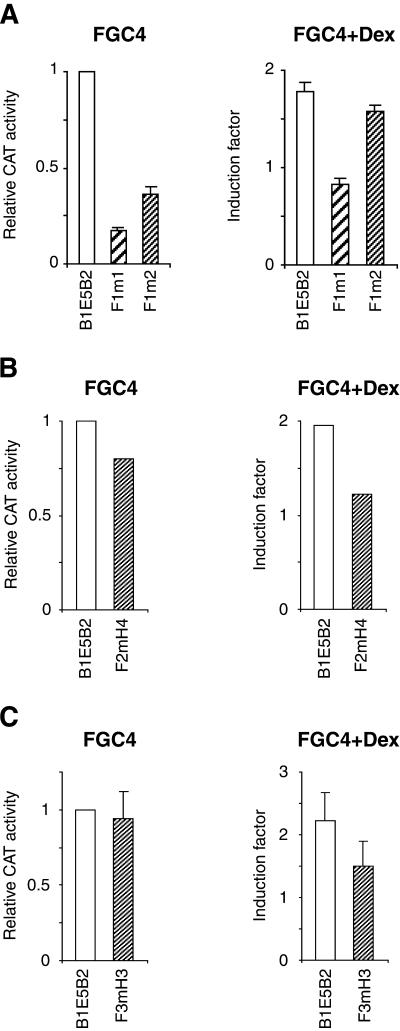
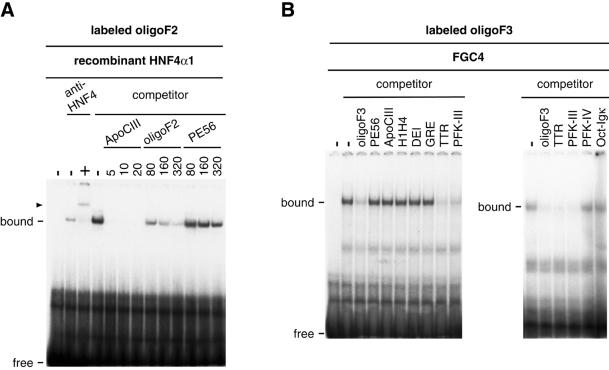
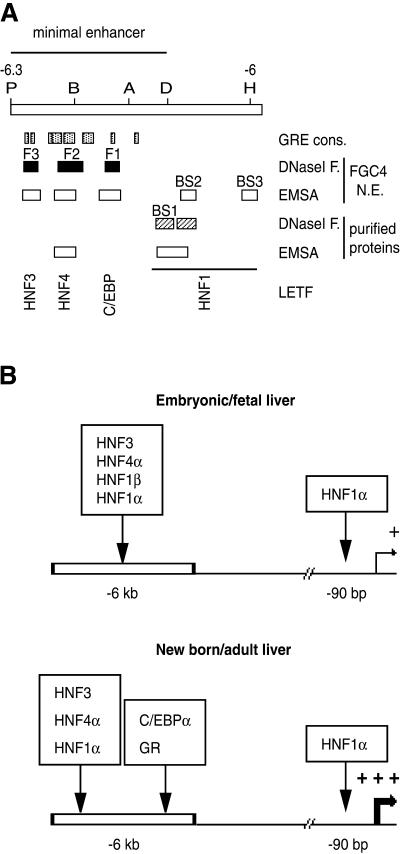
We have characterized a 700 bp enhancer element around -6 kb relative to the HNF4alpha1 transcription start. This element increases activity and confers glucocorticoid induction to a heterologous as well as the homologous promoters in differentiated hepatoma cells and is transactivated by HNF4alpha1, HNF4alpha7, HNF1alpha and HNF1beta in dedifferentiated hepatoma cells. A 240 bp sub-region conserves basal and hormone-induced enhancer activity. It contains HNF1, HNF4, HNF3 and C/EBP binding sites as shown by DNase I footprinting and electrophoretic mobility shift assays using nuclear extracts and/or recombinant HNF1alpha and HNF4alpha1. Mutation analyses showed that the HNF1 site is essential for HNF1alpha transactivation and is required for full basal enhancer activity, as is the C/EBP site. Glucocorticoid response element consensus sites which overlap the C/EBP, HNF4 and HNF3 sites are crucial for optimal hormonal induction. We present a model that accounts for weak expression of HNF4alpha1 in the embryonic liver and strong expression in the newborn/adult liver via the binding sites identified in the enhancer.


Figures

Figure 1
Figure 1
Enhancer activity and Dex inducibility of distal sequences upstream of the HNF4α1 transcription start. (A) (Left) Scheme of the HNF4α1 5′-region showing positions of liver- and kidney-specific HS (13,14), a partial restriction map (B, BamHI; E, EcoRI; G, BglII; X, XbaI) and the transcription start (arrow). (Below) Cloned restriction fragments (B1E4 was cloned in the antisense direction). (Right) CAT activity of the corresponding reporter plasmids transfected in differentiated (FGC4) or dedifferentiated (H5) hepatoma cells or in non-hepatic cells (C33). Values are means of three (FGC4), two to three (H5) or one to four (C33) independent experiments. (B) Activity of the same constructs transfected in FGC4 and H5 cells treated or not with Dex. Means ± SD of three (FGC4) and two to three (H5) independent experiments. (C) Activity in transfected FGC4 cells, treated or not with Dex, of a minimal HNF4α1 promoter (–34) controlled by the 700 bp enhancer, cloned in both orientations, or by HNF4α1 5′-sequences up to –6.8 kb. Means ± SD of two independent experiments.
Figure 2
Figure 2
(A) A 240 bp region of the 700 bp enhancer shows basal and Dex-induced enhancer activities and is transactivated by HNF4α1 and HNF1α. (Left) Restriction map of the enhancer with positions (in kb) relative to the transcription start and schemes of cloned sub-regions. (Middle and right) Activities of the corresponding reporter plasmids either after transfection in FGC4, treated or not with Dex, or co-transfection of H5 with 1 µg of HNF4α1 or HNF1α expression vector. Induction factor represents the ratio of CAT activity in the presence of the factor to that in the presence of the control expression vector. For the 700 bp enhancer, the induction factor is the mean of four to five independent experiments. Induction factors for the other fragments have been normalized to this mean value. Blanks indicate that fragments were not tested for activity. (B) The 700 bp enhancer is transactivated by HNF4α7 (left) and HNF1β (right). H5 cells were co-transfected by the B1E5B2 reporter plasmid and 0.3 or 1 µg of expression vector for HNF4α1, HNF4α7, HNF1β or HNF1α as indicated. CAT activity is expressed as induction factor [see (A)].
Figure 3
Figure 3
DNase I footprints generated by FGC4 and H5 nuclear extracts on the 700 bp enhancer. (A) The BglII–AvaI fragment [see (C)], 32P-labeled on the upper strand at the 3′-end of the AvaI site was incubated in the absence (F) or presence of nuclear extract (20 µg protein) before adding DNase I at final concentrations of 0.7 (F) or 13 and 20 U/ml (FGC4 and H5). G+A and T+C show chemical sequencing reaction products. Footprints (bars) and hyperdigestion sites (arrows) generated by the FGC4 extract are indicated. There are some differences in the DNase I digestion pattern using H5 extract (see text). (B) The same experiment using a HindIII–BamHI fragment 32P-labeled at the 3′-end of the HindIII site (sites in the vector) and containing the PvuII–DraI fragment [see (C); lower strand labeled], and FGC4 nuclear extract. (C) Positions of the DNase I footprints generated by FGC4 nuclear extracts in the enhancer. Results are from (A) and (B) and data not shown. (D) Sequences of the PvuII–AvaI fragment with DNase I footprints (bracketed lines) and hyperdigestion sites (arrows) on the upper and lower strand (above and below the sequence, respectively) indicated. Oligonucleotides used for further analysis are underlined.
Figure 4
Figure 4
C/EBPα binds to F1 in FGC4 cells and rat liver nuclear extracts. (A) Nuclear extracts from cells treated or not with Dex were incubated with labeled oligo F1 in EMSA as indicated. Numbers designate retarded protein–DNA complexes. Free DNA is indicated. (B) The same experiment using nuclear extracts from rat liver and FGC4 cells. Protein concentration is indicated. (C) EMSA of labeled oligo F1 and FGC4 nuclear proteins without (minus) or with competitor oligo F1 or oligonucleotides containing binding sites for HNF1 (PE56), HNF4 (ApoCIII and H1H4), C/EBP (DEI) and GR (GRE). (D) EMSA with labeled oligo F1, FGC4 and H5 nuclear extracts and increasing amounts of anti-C/EBPα antibody. Antibody (1–3 µl, undiluted or 10-fold diluted) was preincubated with nuclear extracts as indicated for 10 min at room temperature, then reactions were completed and incubated for 30 min on ice. Cells were treated with Dex to observe complexes 2 and 4 in H5 cells. Complexes 1 and 3 were supershifted by the antibody (arrowhead).
Figure 5
Figure 5
The C/EBP site is required for full enhancer activity and functional GRE consensus sites overlap with the C/EBP, HNF4 and HNF3 sites. (A) (Left) FGC4 cells were transfected with B1E5B2 reporter plasmids, either wild-type or bearing two different mutations in the C/EBP binding site of F1. An overlapping half-GRE consensus site is affected by mutation in the F1m1 but not in the F1m2 mutant. Activity is expressed relative to B1E5B2. The means ± SD of three (F1m1) or two (F1m2) independent experiments are shown. (Right) Same experiment except that the transfected cells were treated with Dex. Induction factor represents the ratio of CAT activity in the presence and absence of Dex. The means ± SD of three (B1E5B2, F1m1) or two (F1m2) independent experiments are shown. (B) The same experiment except that the B1E5B2 reporter plasmid was mutated in the HNF4 consensus site of F2 (F2mH4). (C) The same experiment except that the B1E5B2 reporter plasmid was mutated in the HNF3 consensus site of F3 (F3mH3). In both the F2mH4 and F3mH3 mutants GRE consensus sites are affected. For the F3mH3 mutant, the mean ± SD of two independent experiments is shown.
Figure 6
Figure 6
Recombinant HNF4α1 binds to F2 (A) and HNF3 to F3 (B). (A) Labeled oligo F2 and recombinant rat HNF4α1 (0.7 µg) were incubated without (minus) or with (plus) an anti-HNF4α1 antibody and without (minus) or with competitor oligonucleotides. The first lane shows migration without protein. For the reaction with the antibody and the control, 1 µl of 10-fold diluted antibody in PBS (plus) or PBS alone (minus) was added to reaction mix that had been preincubated for 15 min on ice. Incubations were carried out for 25 min at room temperature. Other reactions were incubated on ice for 30 min. The arrowhead designates the ternary complex antibody–HNF4–DNA. Oligonucleotide amounts are given in nanograms. Protein–DNA complexes are indicated. (B) Labeled oligo F3 was incubated without (minus) or with FGC4 nuclear extract and competitor oligonucleotides. TTR and PFK-III contain binding sites for HNF3 and HNF6 and for HNF3 and Oct-1, respectively, whereas PFK-IV and Oct-Igκ bind HNF6 and Oct-1, respectively.
Figure 7
Figure 7
Recombinant HNF1α binds to a site at the 3′-end of the 240 bp enhancer (A) and this site is required for HNF1α transactivation (B) and full enhancer activity (C). (A) Purified recombinant truncated rat HNF1α was used at 0.5 µg in EMSA with the labeled oligo BS1 in the absence or presence of increasing amounts (indicated in ng) of competitor oligo PE56, BS1 or BS1m (mutated in BS1). (B) CAT activity of reporter plasmid B1E5B2, wild-type or mutated in BS1 (BS1m*, see text), in H5 co-transfected with HNF1α. For the mutant reporter, the mean ± SD of three independent experiments is shown. Expression vector amounts are indicated. (C) CAT activity in FGC4 of reporter plasmid B1E5B2, wild-type or mutated in BS1 (BS1m* or BS1m). The mean ± SD of two independent experiments is shown.
Figure 8
Figure 8
Overview of the –6 kb enhancer (A) and a model for HNF4α1 regulation (B). (A) A restriction map is shown (P, PvuII; B, BspEI; A, AvaI; D, DraI; H, HpaI). Positions of three imperfect whole and five imperfect half-GRE consensus sites in the minimal enhancer are indicated. Protein binding sites characterized using DNase I footprinting assay and EMSA with FGC4 nuclear extract or purified recombinant proteins are represented. Footprints F1–F3, HNF1 binding sites and LETF binding to the sites are indicated. (B) Schematic representation showing a model of the factors that are expressed and could bind to the HNF4α1 –6 kb enhancer and promoter (14) regions, resulting in low expression during early liver development and a strong up-regulation at birth.

References

    1. Sladek F.M., Zhong,W., Lai,E. and Darnell,J.E.,Jr (1990) Liver-enriched transcription factor HNF-4 is a novel member of the steroid hormone receptor superfamily. Genes Dev., 4, 2353–2365. - PubMed
    1. Duncan S.A., Manova,K., Chen,W.S., Hoodless,P., Weinstein,D.C., Bachvarova,R.F. and Darnell,J.E.,Jr (1994) Expression of transcription factor HNF-4 in the extraembryonic endoderm, gut and nephrogenic tissue of the developing mouse embryo: HNF-4 is a marker for primary endoderm in the implanting blastocyst. Proc. Natl Acad. Sci. USA, 91, 7598–7602. - PMC - PubMed
    1. Ang S.L. and Rossant,J. (1994) HNF-3β is essential for node and notochord formation in mouse development. Cell, 78, 561–574. - PubMed
    1. Barbacci E., Reber,M., Ott,M.O., Breillat,C., Huetz,F. and Cereghini,S. (1999) Variant hepatocyte nuclear factor 1 is required for visceral endoderm specification. Development, 126, 4795–4805. - PubMed
    1. Coffinier C., Thépot,D., Babinet,C., Yaniv,M. and Barra,J. (1999) Essential role for the homeoprotein vHNF1/HNF1β in visceral endoderm differentiation. Development, 126, 4785–4794. - PubMed

Publication types

MeSH terms

Substances

Associated data