. 2001 Sep;118(3):277-90.
doi: 10.1085/jgp.118.3.277.

Functional effects of central core disease mutations in the cytoplasmic region of the skeletal muscle ryanodine receptor

Affiliations

Functional effects of central core disease mutations in the cytoplasmic region of the skeletal muscle ryanodine receptor

G Avila et al. J Gen Physiol. 2001 Sep.

Abstract

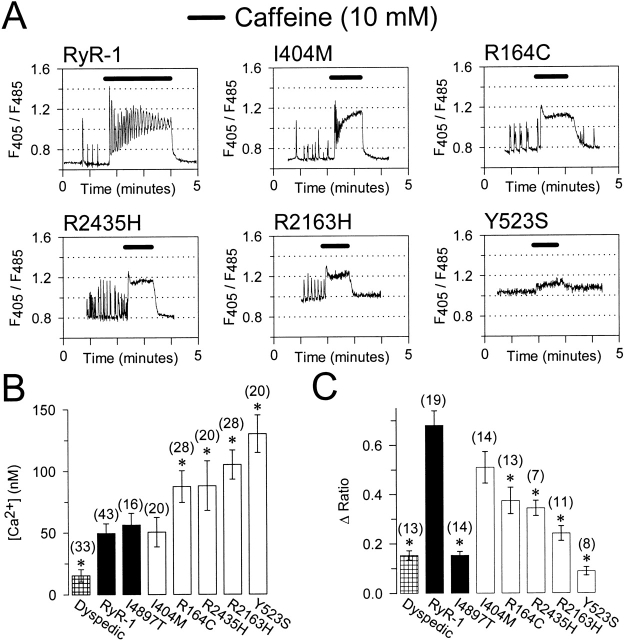
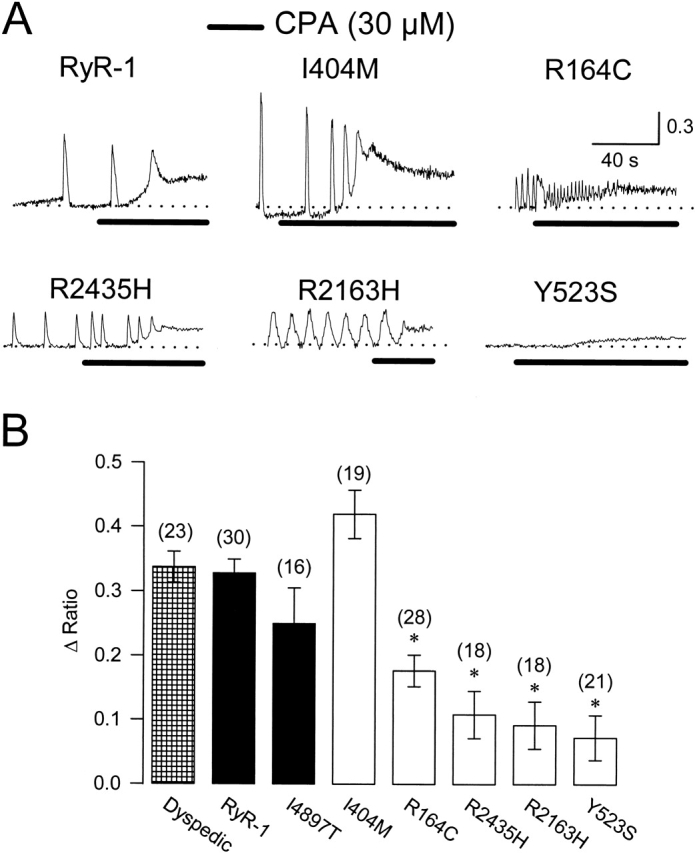
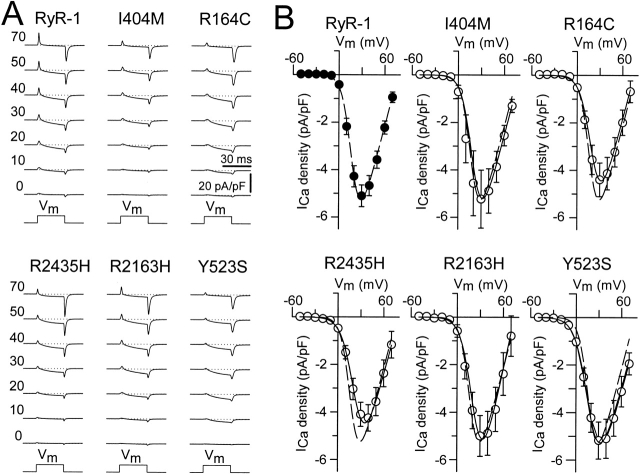
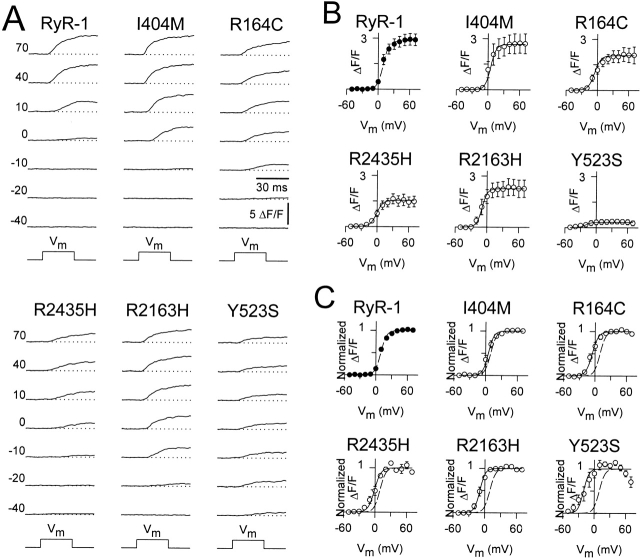
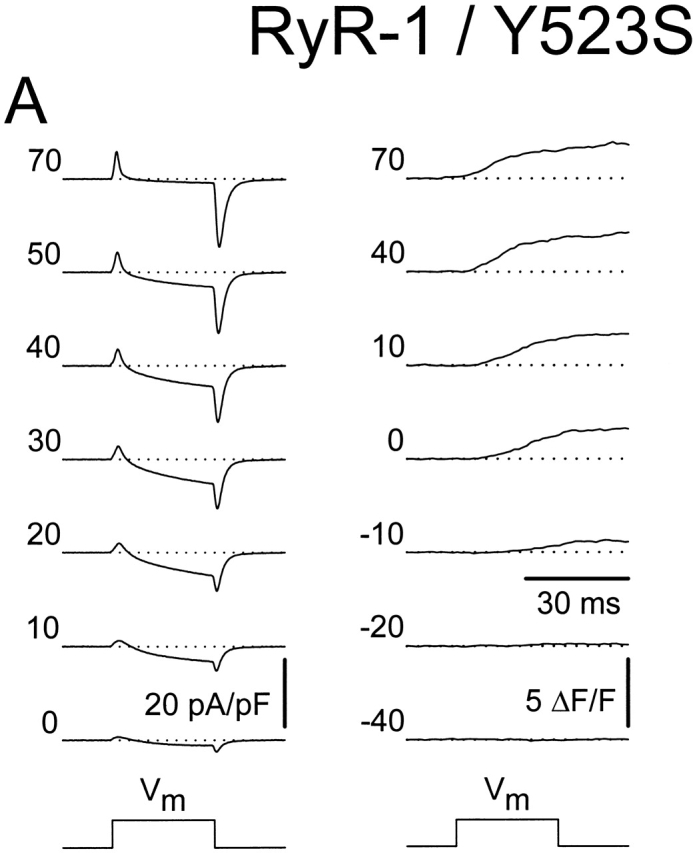
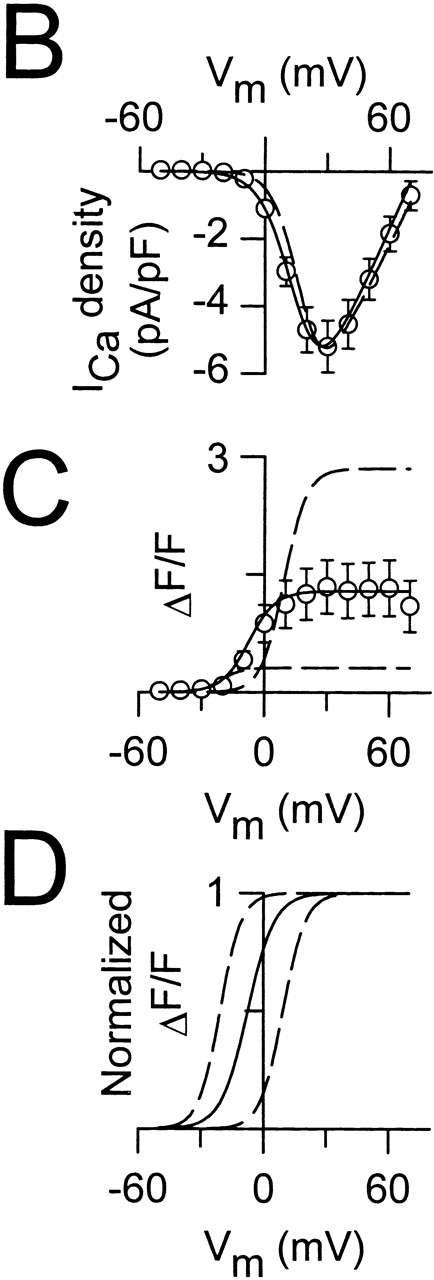
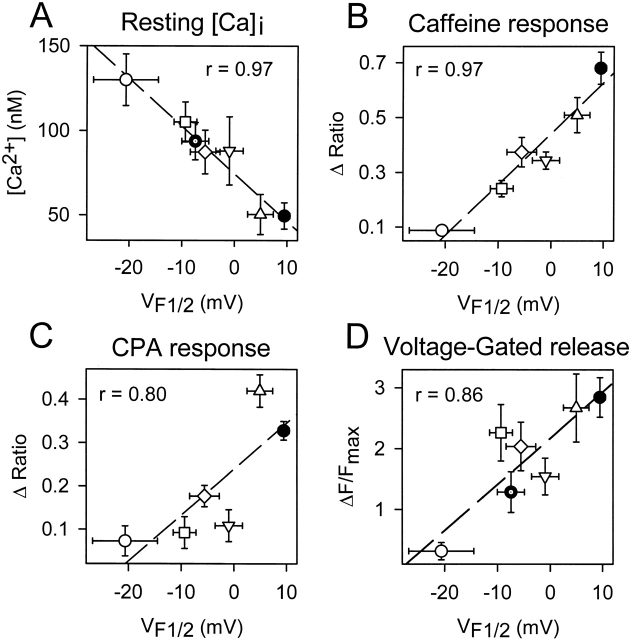
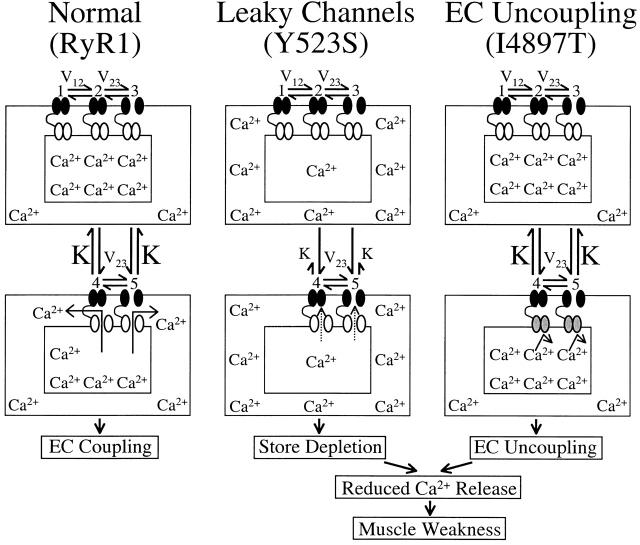
Central core disease (CCD) is a human myopathy that involves a dysregulation in muscle Ca(2)+ homeostasis caused by mutations in the gene encoding the skeletal muscle ryanodine receptor (RyR1), the protein that comprises the calcium release channel of the SR. Although genetic studies have clearly demonstrated linkage between mutations in RyR1 and CCD, the impact of these mutations on release channel function and excitation-contraction coupling in skeletal muscle is unknown. Toward this goal, we have engineered the different CCD mutations found in the NH(2)-terminal region of RyR1 into a rabbit RyR1 cDNA (R164C, I404M, Y523S, R2163H, and R2435H) and characterized the functional effects of these mutations after expression in myotubes derived from RyR1-knockout (dyspedic) mice. Resting Ca(2)+ levels were elevated in dyspedic myotubes expressing four of these mutants (Y523S > R2163H > R2435H R164C > I404M RyR1). A similar rank order was also found for the degree of SR Ca(2)+ depletion assessed using maximal concentrations of caffeine (10 mM) or cyclopiazonic acid (CPA, 30 microM). Although all of the CCD mutants fully restored L-current density, voltage-gated SR Ca(2)+ release was smaller and activated at more negative potentials for myotubes expressing the NH(2)-terminal CCD mutations. The shift in the voltage dependence of SR Ca(2)+ release correlated strongly with changes in resting Ca(2)+, SR Ca(2)+ store depletion, and peak voltage-gated release, indicating that increased release channel activity at negative membrane potentials promotes SR Ca(2)+ leak. Coexpression of wild-type and Y523S RyR1 proteins in dyspedic myotubes resulted in release channels that exhibited an intermediate degree of SR Ca(2)+ leak. These results demonstrate that the NH(2)-terminal CCD mutants enhance release channel sensitivity to activation by voltage in a manner that leads to increased SR Ca(2)+ leak, store depletion, and a reduction in voltage-gated Ca(2)+ release. Two fundamentally distinct cellular mechanisms (leaky channels and EC uncoupling) are proposed to explain how altered release channel function caused by different mutations in RyR1 could result in muscle weakness in CCD.


Figures

Figure 1
Figure 1
Intact dyspedic myotubes expressing NH2-terminal CCD mutants exhibit higher resting Ca2+ levels and a reduced maximal caffeine-induced Ca2+ release. (A) Representative caffeine-induced Ca2+ responses (10 mM caffeine, black bars) in Indo-1 AM–loaded dyspedic myotubes expressing wild-type RyR1, I404M, R164C, R2435H, R2163H, or Y523S. The abscissa for each panel corresponds to 5 min. (B) Average resting Ca2+ levels in dyspedic myotubes expressing RyR1 and the different CCD mutations. Unstimulated Indo-1 fluorescence ratios were converted to resting Ca2+ levels using an in situ calibration approach (Avila et al. 2001a). (C) Average maximal caffeine-induced Ca2+ release (Δ Ratio = Rcaffeine − Rbaseline). Asterisks indicate significant differences (P < 0.05) compared with RyR1.
Figure 2
Figure 2
Intact dyspedic myotubes expressing NH2-terminal CCD mutants exhibit reduced CPA-induced Ca2+ release. (A) Representative CPA-induced Ca2+ responses (30 μM, black bars) in Indo-1 AM–loaded dyspedic myotubes expressing wild-type RyR1, I404M, R164C, R2435H, R2163H, or Y523S. For comparison, fluorescence ratios are aligned to their respective baseline levels (dotted lines). (B) Average steady-state CPA-induced Ca2+ release (Δ Ratio = RCPA − Rbaseline) measured 2–3 min after the initial application of CPA. Asterisks indicate significant differences (P < 0.05) compared with RyR-1.
Figure 3
Figure 3
The NH2-terminal CCD mutants fully restore retrograde coupling. (A) Representative whole-cell L-currents recorded in response to 30-ms depolarizing pulses to the indicated membrane potentials (left). (B) Average peak I-V curves for dyspedic myotubes expressing wild-type RyR1 (n = 20), I404M (n = 7), R164C (n = 10), R2435H (n = 8), R2163H (n = 6), or Y523S (n = 11). The average values (±SEM) for the parameters obtained by fitting each myotube within a group separately to are given in Table (I–V data). The solid lines through the data were generated using and the corresponding parameters given in Table ([dashed line] RyR1 and [continuous line] CCD mutants).
Figure 4
Figure 4
The NH2-terminal CCD mutants increase SR Ca2+ release channel sensitivity to activation by voltage and reduce maximal voltage-gated SR Ca2+ release. (A) Intracellular Ca2+ transients (ΔF/F) elicited by 30-ms test pulses to the indicated potentials (left). (B) Average voltage dependence of peak intracellular Ca2+ transients as recorded in A. The average values (±SEM) for the parameters obtained by fitting each myotube within a group separately to are given in Table (ΔF/F -V data). The solid lines through the data were generated using and the corresponding parameters given in Table ([dashed line] RyR1 and [continuous lines] CCD mutants). (C) The ΔF/F-V data and curves in B were normalized to their respective maximal value ((ΔF/F)max) ([dashed line] RyR-1 and [continuous lines] CCD mutants). The decline in the magnitude of the Y523S Ca2+ transients at potentials greater than +30 mV arises from a reduction in L-current magnitude at these potentials.
Figure 5
Figure 5
Coexpression of the wild-type RyR1 and Y523S causes an intermediate shift in formula image and a moderate reduction in voltage-gated SR Ca2+ release. (A) L-currents (left) and intracellular Ca2+ transients (right) obtained from a representative RyR1/Y523S-expressing dyspedic myotube. Average voltage dependence of maximal L-currents (B) and Ca2+ transients (C) in RyR-1/Y523S-expressing myotubes (n = 13). The continuous lines were calculated using (B) and (C) from the values reported in Table . The average I-V and F-V curves for RyR1- and Y523S-expressing myotubes are illustrated for comparison (dashed lines). (D) The ΔF/F-V curves in C were normalized to their respective maximal value (ΔF/F)max.
Figure 5
Figure 5
Coexpression of the wild-type RyR1 and Y523S causes an intermediate shift in formula image and a moderate reduction in voltage-gated SR Ca2+ release. (A) L-currents (left) and intracellular Ca2+ transients (right) obtained from a representative RyR1/Y523S-expressing dyspedic myotube. Average voltage dependence of maximal L-currents (B) and Ca2+ transients (C) in RyR-1/Y523S-expressing myotubes (n = 13). The continuous lines were calculated using (B) and (C) from the values reported in Table . The average I-V and F-V curves for RyR1- and Y523S-expressing myotubes are illustrated for comparison (dashed lines). (D) The ΔF/F-V curves in C were normalized to their respective maximal value (ΔF/F)max.
Figure 6
Figure 6
The degree of altered release channel activity for the different NH2-terminal CCD mutations in RyR1 correlates with a hyperpolarizing shift in formula image. Average resting Ca2+ levels (A), maximal caffeine response (B), maximal CPA response (C), and maximal voltage-gated Ca2+ release (D) are plotted as a function of formula image for RyR1 and the different NH2-terminal CCD mutants. Symbols represent RyR1 (closed circle), R164C (open diamond), I404M (open triangle), Y523S (open circle), R2163H (open square), R2435H (inverted open triangle), and RyR1/Y523S (dotted closed circle).
Figure 7
Figure 7
Schematic representation for alterations in Ca2+ homeostasis and EC coupling in dyspedic myotubes expressing normal (left, RyR1), leaky (middle, Y523S), and EC uncoupled (right, I4897T) SR Ca2+ release channels. Each model is based on the 5-state reaction scheme for coupled DHPRs and RyR1s (Dietze et al. 2000). A thin black line connecting DHPR (black channels) and RyR1 proteins (white and gray channels) is used to represent mechanical coupling. The number of Ca2+ symbols represents relative myoplasmic and luminal SR Ca2+ levels. In each scheme, L-channels are assumed to exist in one of three distinct states governed by two voltage-dependent transitions (V12 and V23): (1) resting (closed), (2) preactive (closed), and (3) open (open). In each of these states, coupled SR Ca2+ release channels can exist in either a closed (states 1–3) or open configuration (states 4 and 5). A reduction in the voltage-independent equilibrium constant (K) for the release channel open-closed reaction causes a selective negative shift in formula image without an alteration in formula image. The selective, but variable shifts in formula image produced by the different NH2-terminal CCD mutations in RyR1, could arise from different degrees of reductions in K in the model for Y523S. Increased release channel activity at negative potentials could result in SR Ca2+ leak and the subsequent depletion of SR Ca2+ stores. Our previous results demonstrated that I4897T-expressing myotubes lack voltage-gated SR Ca2+ release in the absence of a change in either resting Ca2+ levels or SR Ca2+ content (Avila et al. 2001a). However, the I4897T mutation apparently does not alter K, since the value of formula image was similar for dyspedic myotubes expressing RyR1 alone and both RyR1 and I4897T. Thus, the I4897T mutation may result in release channels that conduct Ca2+ poorly after activation (depicted as gray release channels). Both cellular mechanisms (“leaky” and “uncoupled” SR Ca2+ release channels) would be expected to result in muscle weakness as a consequence of reduced voltage-gated SR Ca2+ release. Disorganization of the contractile proteins and a reduction in energy supply within the core regions are also likely to contribute to muscle weakness in CCD (Loke and MacLennan 1998; MacLennan and Phillips 1995).

References

    1. Avila G., Dirksen R.T. Functional impact of the ryanodine receptor on the skeletal muscle L-type Ca2+ channel. J. Gen. Physiol. 2000;4:467–480. - PMC - PubMed
    1. Avila G., O'Brien J.J., Dirksen R.T. Excitation-contraction uncoupling by a human central core disease mutation in the ryanodine receptor Proc. Natl. Acad. Sci. USA. 7 2001. 4215 4220a - PMC - PubMed
    1. Avila G., O'Connell K.M.S., Groom L., Dirksen R.T. Ca2+ release through ryanodine receptors regulates skeletal muscle L-type Ca2+ channel expression J. Biol. Chem. 276 2001. 17732 17738b - PubMed
    1. Balshaw D., Gao L., Meissner G. Luminal loop of the ryanodine receptora pore-forming segment? Proc. Natl. Acad. Sci. USA. 1999;7:3345–3347. - PMC - PubMed
    1. Barone V., Massa O., Intravaia E., Bracco A., Di Martino A., Tegazzin V., Cozzolino S., Sorrentino V. Mutation screening of the RYR1 gene and identification of two novel mutations in Italian malignant hyperthermia families. J. Med. Genet. 1999;2:115–118. - PMC - PubMed

Publication types

MeSH terms