. 2001 Sep;118(3):303-14.
doi: 10.1085/jgp.118.3.303.

KcsA: it's a potassium channel

Affiliations

KcsA: it's a potassium channel

M LeMasurier et al. J Gen Physiol. 2001 Sep.

Abstract

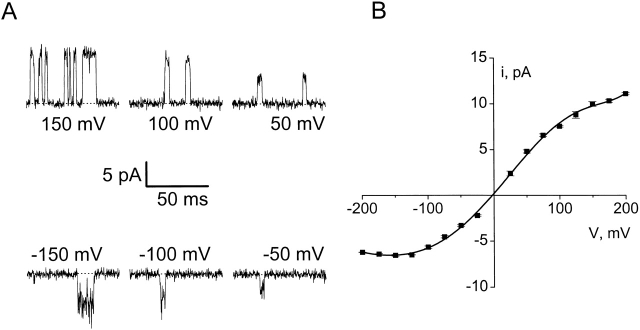
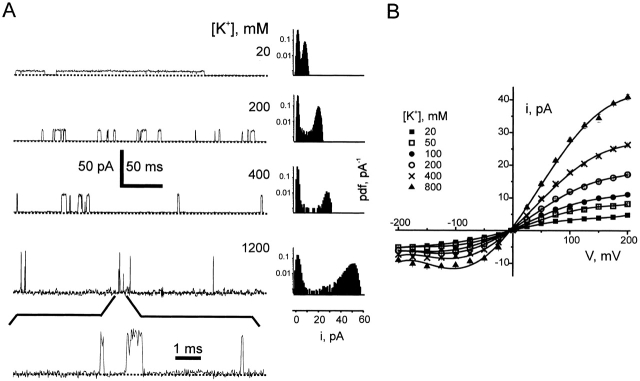
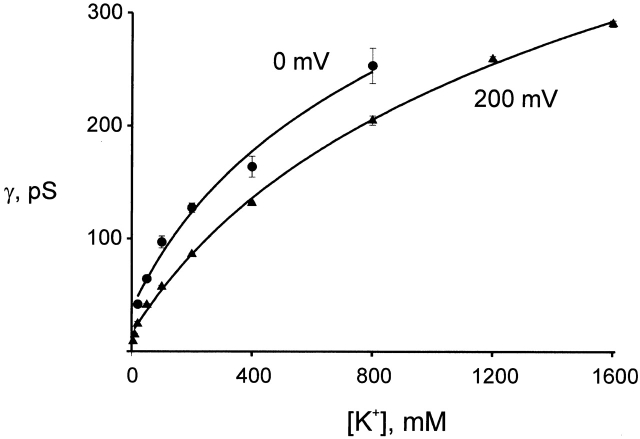
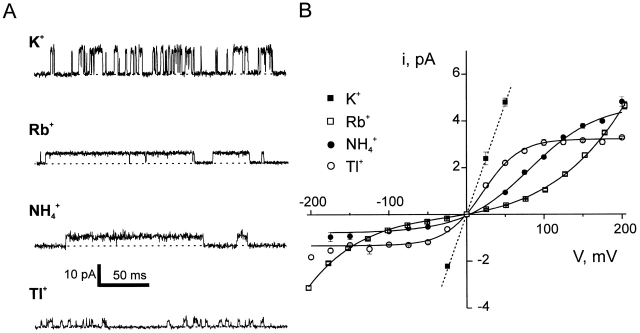
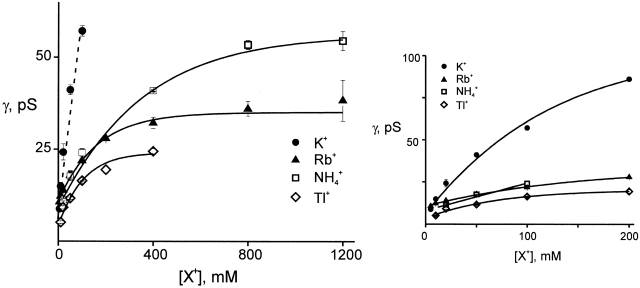
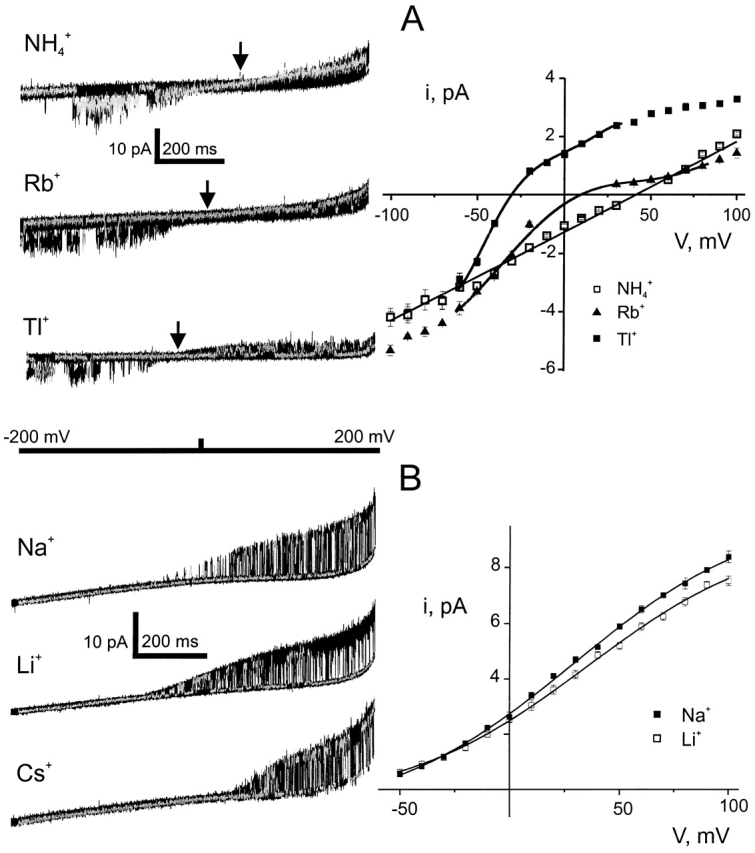
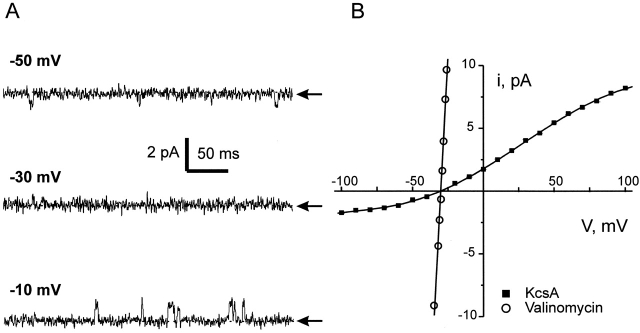
Ion conduction and selectivity properties of KcsA, a bacterial ion channel of known structure, were studied in a planar lipid bilayer system at the single-channel level. Selectivity sequences for permeant ions were determined by symmetrical solution conductance (K(+) > Rb(+), NH(4)(+), Tl(+) >> Cs(+), Na(+), Li(+)) and by reversal potentials under bi-ionic or mixed-ion conditions (Tl(+) > K(+) > Rb(+) > NH(4)(+) >> Na(+), Li(+)). Determination of reversal potentials with submillivolt accuracy shows that K(+) is over 150-fold more permeant than Na(+). Variation of conductance with concentration under symmetrical salt conditions is complex, with at least two ion-binding processes revealing themselves: a high affinity process below 20 mM and a low affinity process over the range 100-1,000 mM. These properties are analogous to those seen in many eukaryotic K(+) channels, and they establish KcsA as a faithful structural model for ion permeation in eukaryotic K(+) channels.


Figures

Figure 1
Figure 1
Single-channel currents through KcsA. (A) Recordings are shown of single KcsA channels in symmetrical 100 mM KCl at the voltages indicated. The closed state is indicated by dashed lines. (B) Open-channel current-voltage relation. Mean ± standard deviations are shown; standard errors are smaller than the width of the points. Solid curve has no theoretical meaning.
Figure 2
Figure 2
KcsA currents in varying concentrations of K+. Currents were recorded in symmetrical K+ solutions at the concentrations indicated, at a holding potential of 200 mV. (A) Representative single-channel openings accompanied by amplitude histograms (calculated as probability density, pdf) taken on 0.7–15 s data blocks from which long-lived closed intervals were excluded. Recordings were filtered at 2 kHz, except for the trace at 1,200 mM K+, which was recorded at 10 kHz filtering; this record is displayed with 2 kHz digital filtering and in the expanded timescale at 10 kHz to show full-amplitude openings. (B) I-V curves at K+ concentrations are indicated. Solid lines are polynomial fits for the determination of the zero-voltage conductance. Above 800 mM K+, open probability becomes so low that full I-V curves could not be measured.
Figure 3
Figure 3
Conductance-concentration curve for KcsA in K+. Conductance of KcsA in symmetrical K+ solutions was determined in two ways: by the zero-voltage slope conductance (circles) and from 200 mV chord conductance (triangles). Solid lines have no theoretical meaning.
Figure 4
Figure 4
Selectivity of KcsA: permeant ions under symmetrical conditions. Channels were recorded in 100 mM symmetrical solutions of the ions indicated. (A) Representative single-channel openings at 200 mV. (B) Single-channel I-V curves, as in Fig. 1. Dashed curve compares I-V relation for K+, as in Fig. 1 B.
Figure 5
Figure 5
Conductance-concentration curves for permeant ions. KcsA conductance at 200 mV was measured with symmetrical solutions of the indicated concentrations of Tl+, NH4 +, and Rb+, as for K+ in Fig. 2. For clarity, data are shown at two different concentration and conductance scales.
Figure 6
Figure 6
KcsA selectivity under bi-ionic conditions. Currents from KcsA were recorded with 100 mM K+ on the extracellular side and 100 mM of the indicated test cation on the intracellular side. For each data set, 100 voltage-ramps (–200 mV to 200 mV over 1 s) were accumulated; for ease of viewing, only a subset for each trial is shown, and an individual ramp is highlighted in gray (left). Arrows indicate reversal potentials separately determined from I-V curves (right) measured under identical ionic conditions at constant holding voltages. Junction potential corrections were less than 2 mV for permeant ions. (A) Permeant ions. (B) Impermeant ions.
Figure 7
Figure 7
Lack of Na+ permeability under mixed ion conditions. Single-channel recordings were collected with 100 mM K+ internal and 20 mM K+ + 100 mM Na+ external. After recording the channels, valinomycin (10–50 μM) was added to the external solution to produce a large, ideally K+-selective leak in the planar bilayer, and another I-V curve was taken. Left: illustrative single-channel openings taken on either side of the KcsA reversal potential. Right: I-V curves for KcsA-mediated current (filled points) and valinomycin-mediated current (open points). Average value (± s.e.) of Vr taken from four separate experiments was 180 ± 250 μV.

References

    1. Abramson J.J., Shamoo A.E. Anionic detergents as divalent cation ionophores across black lipid membranes. J. Membr. Biol. 1979;50:241–255. - PubMed
    1. Adelman W.J., French R.J. Blocking of the squid axon potassium channel by external caesium ions. J. Physiol. (Lond.) 1978;276:13–25. - PMC - PubMed
    1. Begenisich T.B., DeWeer P. Potassium flux ratio in voltage-clamped squid giant axons. J. Gen. Physiol. 1980;76:83–98. - PMC - PubMed
    1. Bezanilla F., Armstrong C.M. Negative conductance caused by entry of sodium and cesium ions into the potassium channels of squid axons. J. Gen. Physiol. 1972;60:588–608. - PMC - PubMed
    1. Blatz A., Magleby K. Ion conductance and selectivity of single calcium-activated potassium channels in cultured rat muscle. J. Gen. Physiol. 1984;84:1–23. - PMC - PubMed

Publication types