. 2001 Sep;67(9):4233-41.
doi: 10.1128/AEM.67.9.4233-4241.2001.

Bacteriophage latent-period evolution as a response to resource availability

Affiliations

Bacteriophage latent-period evolution as a response to resource availability

S T Abedon et al. Appl Environ Microbiol. 2001 Sep.

Abstract

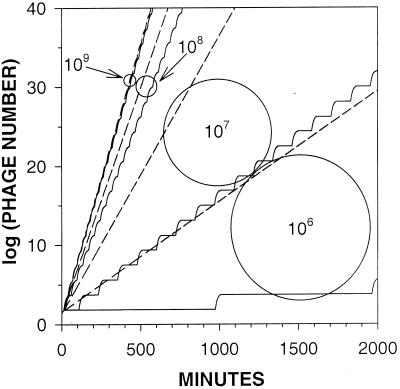
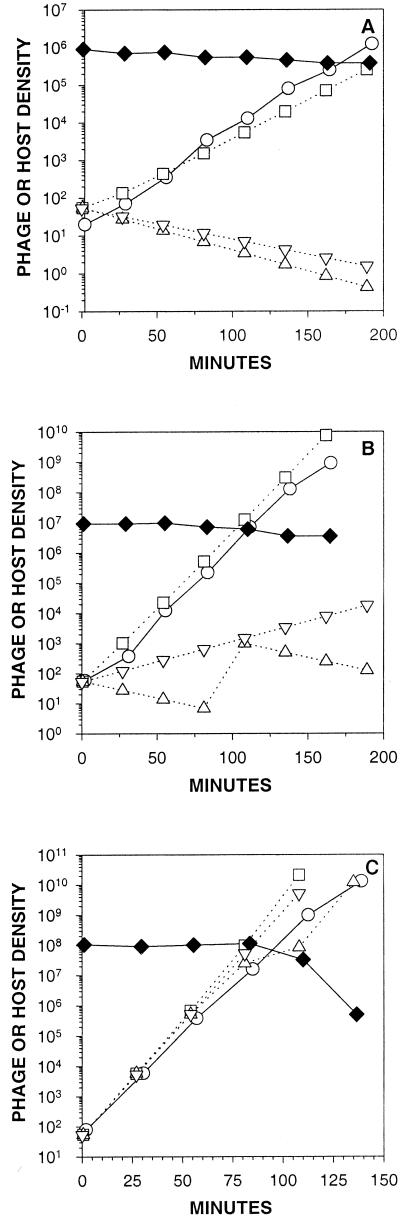
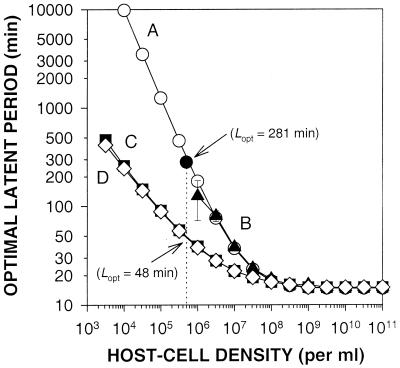
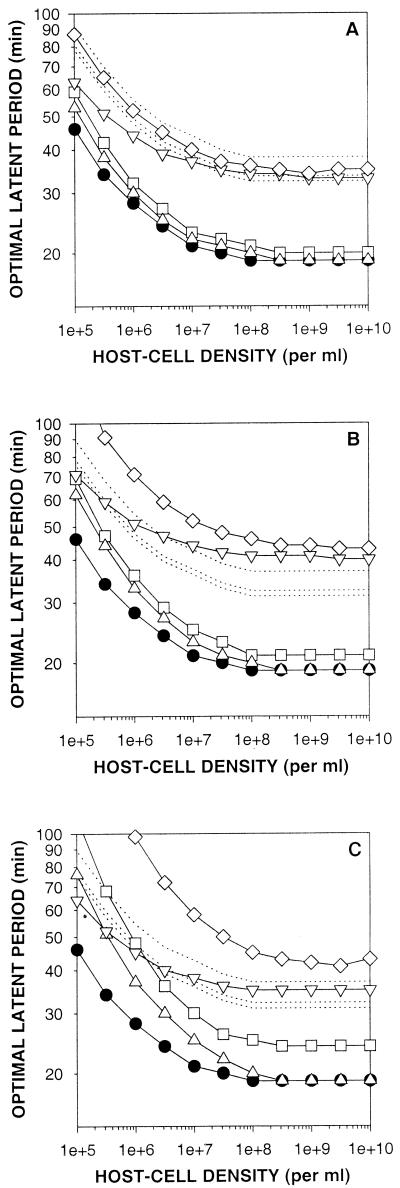
Bacteriophages (phages) modify microbial communities by lysing hosts, transferring genetic material, and effecting lysogenic conversion. To understand how natural communities are affected it is important to develop predictive models. Here we consider how variation between models--in eclipse period, latent period, adsorption constant, burst size, the handling of differences in host quantity and host quality, and in modeling strategy--can affect predictions. First we compare two published models of phage growth, which differ primarily in terms of how they model the kinetics of phage adsorption; one is a computer simulation and the other is an explicit calculation. At higher host quantities (approximately 10(8) cells/ml), both models closely predict experimentally determined phage population growth rates. At lower host quantities (10(7) cells/ml), the computer simulation continues to closely predict phage growth rates, but the explicit model does not. Next we concentrate on predictions of latent-period optima. A latent-period optimum is the latent period that maximizes the population growth of a specific phage growing in the presence of a specific quantity and quality of host cells. Both models predict similar latent-period optima at higher host densities (e.g., 17 min at 10(8) cells/ml). At lower host densities, however, the computer simulation predicts latent-period optima that are much shorter than those suggested by explicit calculations (e.g., 90 versus 1,250 min at 10(5) cells/ml). Finally, we consider the impact of host quality on phage latent-period evolution. By taking care to differentiate latent-period phenotypic plasticity from latent-period evolution, we argue that the impact of host quality on phage latent-period evolution may be relatively small.


Figures

FIG. 1
FIG. 1
Phage production with and without MFT simplification. Computer simulations were run for 2,000 min, starting with 1 phage per environment. Shown is the number of phages produced by simulations using equation 3 (dashed lines) or MFT (solid lines) to define phage adsorption. E, R, and k are defined according to Wang et al. (29 and see Table 1), and L was set equal to 25 min. The shown simulations were incremented in 1-min intervals. Curves differ in terms of the density of host cells (per milliliter) as indicated. The 109-cells/ml curves from both methods nearly overlap.
FIG. 2
FIG. 2
Phage growth, theoretical versus experimental. Results from experiments are shown as solid lines (circles represent phage titers, diamonds represent cell viable counts). Initial host densities for panels A, B, and C are approximately 106, 107, and 108 cells/ml, respectively. Simulations (dotted lines) were done with phage adsorption modeled by using the equation 3 exponential decay function (squares) or by employing the MFT phage adsorption algorithm (triangles). A MFT-based calculation employing equation 2 is also presented (inverted triangles). The last cell count point shown in panel C was arbitrarily given a value of 5 × 10⁵ cells/ml to substitute for the otherwise not graphable 0 × 106 cells/ml actually observed.
FIG. 3
FIG. 3
Impact of host density on phage latent-period optima. For curve A, latent-period optima were explicitly calculated (open circles). Computer simulations were used to generate all other curves, including curve B, which employs the MFT and equation 1 (triangles), curve C, which employs equations 3 and 1 (squares), and curve D, which employs equations 3 and 4 (diamonds). The solid circle is a single datum from Wang et al. (29).
FIG. 4
FIG. 4
Impact of host quality on latent-period optima. Solid-line curves represent latent-period optima and were found as described for Fig. 3 (curve C). Dotted-line curves indicate latent-period phenotypic plasticity and were generated as described in the text. Solid circles represent latent-period optima determined by employing E, R, and k values found using the richer LBG medium. Phage growth was also simulated with E, R, and k (as presented in Table 1) obtained from host growth on GLU (A), GLY (B), and ACET (C). Curves represented by open symbols define E, R, or k in terms of growth with either only E varied from LBG values (inverted triangles), only R varied (squares), only k varied (upright triangles), or E, R, and k simultaneously varied (diamonds).

References

    1. Abedon S T. Selection for bacteriophage latent period length by bacterial density: a theoretical examination. Microb Ecol. 1989;18:79–88. - PubMed
    1. Abedon S T. Selection for lysis inhibition in bacteriophage. J Theor Biol. 1990;146:501–511. - PubMed
    1. Abedon S T. Lysis of lysis inhibited bacteriophage T4 infected cells. J Bacteriol. 1992;174:8073–8080. - PMC - PubMed
    1. Ackermann H-W, Krisch H M. A catalogue of T4-type bacteriophages. Arch Virol. 1997;142:2329–2345. - PubMed
    1. Adams M H. Bacteriophages. New York, N.Y: Interscience; 1959.

LinkOut - more resources