. 2001 Sep 11;98(19):10682-6.
doi: 10.1073/pnas.191189098. Epub 2001 Aug 28.

Multiple conformations of PEVK proteins detected by single-molecule techniques

Affiliations

Multiple conformations of PEVK proteins detected by single-molecule techniques

H Li et al. Proc Natl Acad Sci U S A. .

Abstract

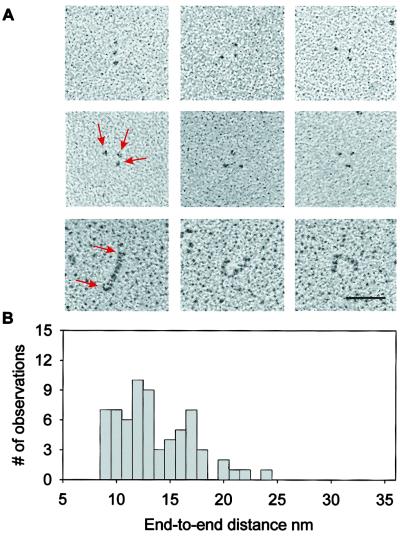
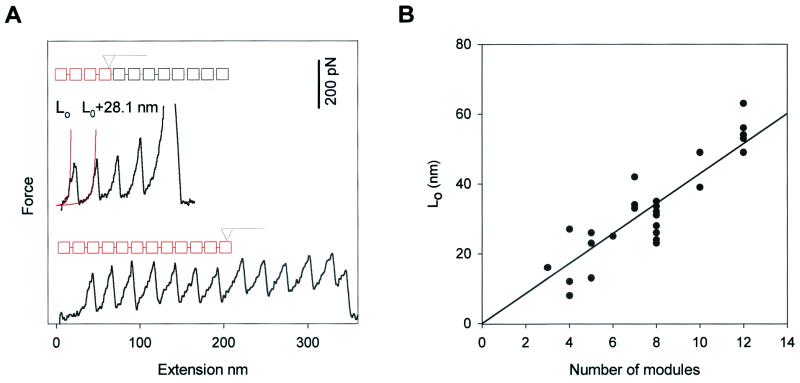
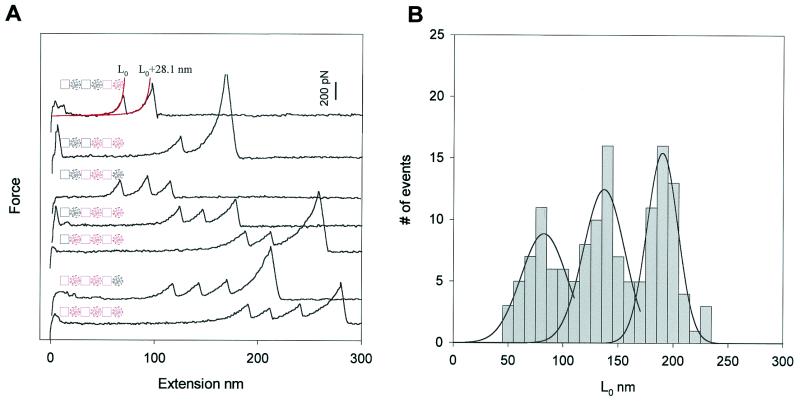
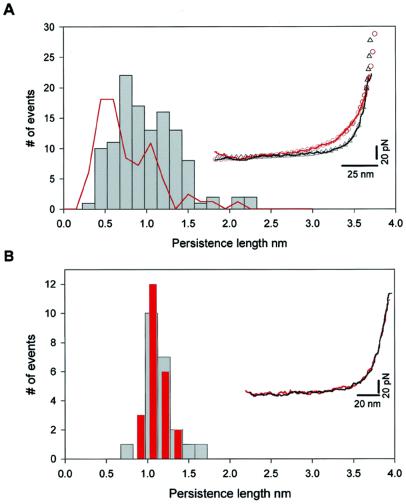
An important component of muscle elasticity is the PEVK region of titin, so named because of the preponderance of these amino acids. However, the PEVK region, similar to other elastomeric proteins, is thought to form a random coil and therefore its structure cannot be determined by standard techniques. Here we combine single-molecule electron microscopy and atomic force microscopy to examine the conformations of the human cardiac titin PEVK region. In contrast to a simple random coil, we have found that cardiac PEVK shows a wide range of elastic conformations with end-to-end distances ranging from 9 to 24 nm and persistence lengths from 0.4 to 2.5 nm. Individual PEVK molecules retained their distinctive elastic conformations through many stretch-relaxation cycles, consistent with the view that these PEVK conformers cannot be interconverted by force. The multiple elastic conformations of cardiac PEVK may result from varying degrees of proline isomerization. The single-molecule techniques demonstrated here may help elucidate the conformation of other proteins that lack a well-defined structure.


Figures

Figure 1
Figure 1
EM of individual (I27-PEVK)3 polyproteins. (A) Representative (I27-PEVK)3 (Top and Middle) and I2712 (Bottom) molecules as seen by rotary-shadowing EM. The polyprotein is visible as three small globular particles (I27 modules), apparently connected by an invisible thread (PEVK). In contrast, rotary-shadowed images of I2712 show solid rods with an average length of 58 nm, predicting a folded length of ≈4.8 nm/module. The bar corresponds to 50 nm. (B) A histogram of the average distance between I27 modules, corresponding to the end-to-end distance of PEVK, shows a broad distribution from 9 to 24 nm, with apparent peaks at 11 and 17 nm.
Figure 2
Figure 2
Characteristic fingerprint of I27 domain unfolding by a stretching force. (A) Stretching of an I2712 polyprotein produces a force-extension curve showing the characteristic sawtooth pattern of unfolding. The force-extension curves show different number of sawteeth, depending on the number of modules picked up by the AFM tip. The red squares represent the modules being picked up in this particular experiment. The solid lines are fits of the data to the WLC model of polymer elasticity. L0 is the contour length of the fully folded polyprotein; upon module unfolding at about ≈200 pN, an additional 28.1 nm will be added to the contour length of the protein. (B) Relationship between L0, determined from the fit to the first sawtooth, and the number of modules picked up by the AFM tip, determined by the number of sawteeth. The solid line is a linear regression of the data with a slope of 4.3 nm/module.
Figure 3
Figure 3
Identification and measurement of the elasticity of a PEVK segment. (A) Stretching an (I27-PEVK)3 polyprotein produces a sawtooth pattern only after a long initial spacer, L0. The sawtooth peaks are typical for I27 domain unfolding because they occur at 200 pN and extend the protein by ≈28.1 nm. Events with only one I27 unfolding event show two discrete values of L0: ≈82 nm or ≈135 nm (top two traces). When two or three I27 domains unfold we can measure an even longer value for L0 at ≈190 nm. The discrete values of L0 result from stretching one, two, or three PEVK segments before any I27 module unfolding occurs. The diagrams of the polyprotein accompanying each record show the various combinations of modules picked up by the AFM tip, where red squares and red circles represent I27 modules and PEVK segments being picked up, respectively. (B) Frequency histogram for the initial length L0. The distribution shows three clearly separated peaks (n = 142 recordings). Gaussian fits give distributions that peak at 82, 135, and 190 nm.
Figure 4
Figure 4
The PEVK segment of cardiac titin shows multiple mechanical conformations. (A) Frequency histogram of the measured persistence length of the PEVK segment (gray bars). The force-extension relationships are accurately described by the WLC model of polymer elasticity (as shown in the Inset). The close agreement between the WLC model and the data (within ≈5 pN) demonstrates that extension of the PEVK segment does not involve the rupture of hydrogen-bonded structures. The PEVK segment shows a wide range of persistence length values, in agreement with the persistence lengths calculated from the end-to-end distributions observed with EM (red line). (Inset) Two representative PEVK recordings with different persistence lengths. In these two traces only the initial length of a stretched (I27-PEVK)3 polyprotein (before I27 domain unfolding) is shown (solid lines are experimental recordings, open symbols are Levenberg–Marquardt nonlinear fit of WLC model to the individual recordings). The red recording has a persistence length of 0.40 nm, the black recording has a persistence length of 1.08 nm. For comparison, the red recording (with a contour length of 207 nm) was normalized to have the same contour length as the black trace (140 nm). (B) Frequency histogram of the measured persistence length of the PEVK segments of a single (I27-PEVK)3 molecule during repeated stretch and relaxation cycles. The persistence length is narrowly distributed around 1.1 nm and is the same for the stretch (gray bars) and the relaxation (red bars) traces, showing that there is no detectable change in persistence length during these cycles. The scatter is due to the error margin of the fits to the data. (Inset) Two consecutive stretch (black) and relaxation (red) recordings. No hysteresis between stretching and relaxation was observed, indicating that this process is fully reversible.

References

    1. Tatham A S, Shewry P R. Trends Biochem Sci. 2000;25:567–571. - PubMed
    1. Labeit S, Kolmerer B. Science. 1995;270:293–296. - PubMed
    1. Linke W A, Ivemeyer M, Mundel P, Stockmeier M R, Kolmerer B. Proc Natl Acad Sci USA. 1998;95:8052–8057. - PMC - PubMed
    1. Linke W A, Granzier H. Biophys J. 1998;75:2613–2614. - PMC - PubMed
    1. Marko J F, Siggia E D. Macromolecules. 1995;28:8759–8770.

Publication types