. 2001 Aug;34(4):253-66.
doi: 10.1046/j.0960-7722.2001.00216.x.

Cell migration and organization in the intestinal crypt using a lattice-free model

Affiliations

Cell migration and organization in the intestinal crypt using a lattice-free model

F A Meineke et al. Cell Prolif. 2001 Aug.

Abstract

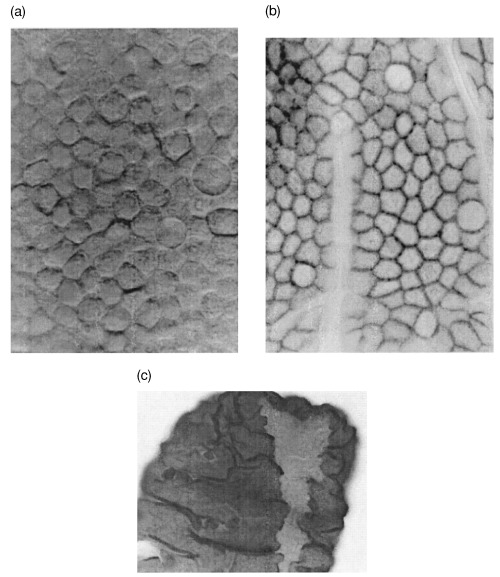
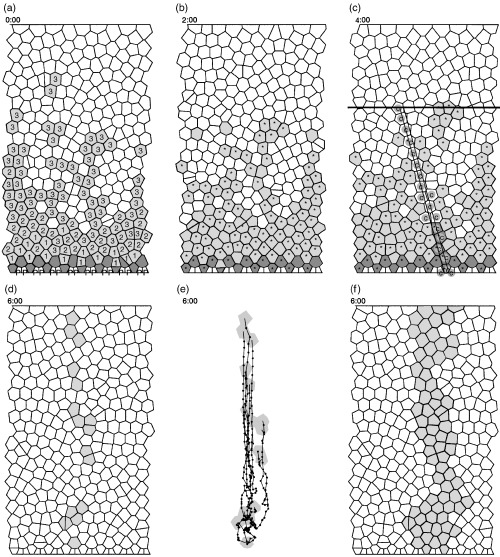
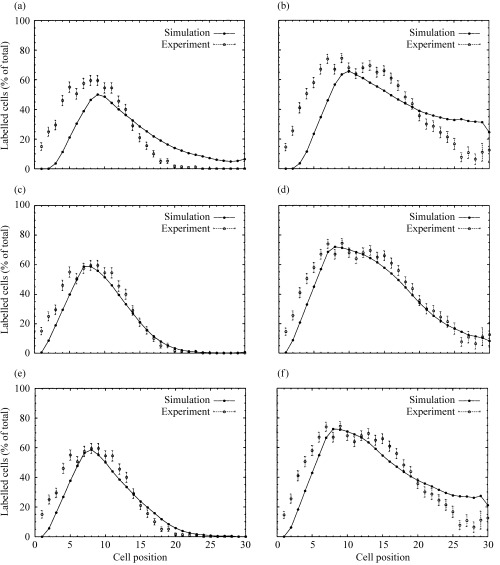
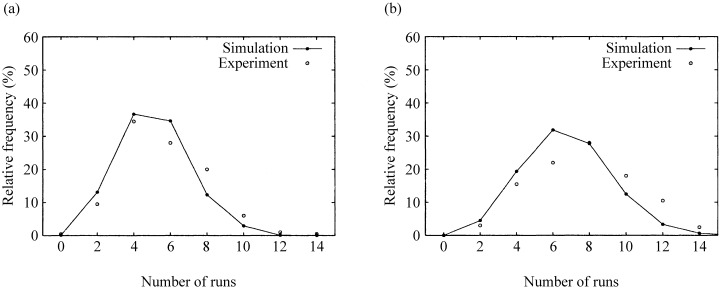
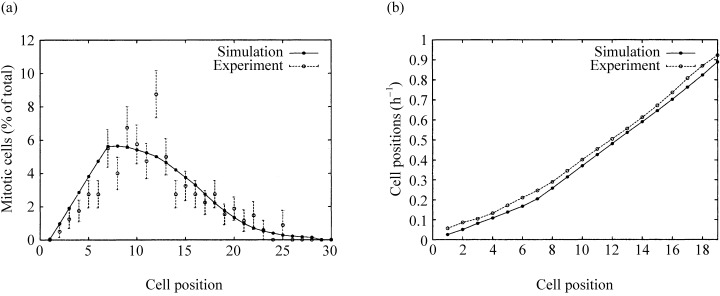
We present a novel class of spatial models of cell movement and arrangement applied to the two-dimensional cellular organization of the intestinal crypt. The model differs from earlier approaches in using a dynamic movement on a lattice-free cylindrical surface. Cell movement is a consequence of mitotic activity. Cells interact by viscoelastic forces. Voronoi tessellation permits simulations of individual cell boundaries. Simulations can be compared with experimental data obtained from cell scoring in sections. Simulation studies show that the model is consistent with the experimental results for the spatial distribution of labelling indices, mitotic indices and other observed phenomena using a fixed number of stem cells and a fixed number of transit cell divisions.


Figures

Figure 1
Figure 1
Intestinal villus. (a) Surface (differential interference microscopy); (b) β‐Catenin staining showing cell–cell borders (light microscopy); (c) NEU‐induced ribbon of mutated cells (light microscopy) (Loeffler et al. 1993).
Figure 2
Figure 2
Various simulation snapshots. (a) White non‐differentiating cells, light grey transit cells of shown generation, dark grey stem cells and white Paneth cells, marked with a P. Simulation time t = 0:00. (b) Same simulation at t = 2:00. Cells in S‐phase have been marked by an asterisk. (c) A simulated section at t = 4:00. The S‐phase cells are as in (b). The cell marked with a c represent cells that might occur in a longitudinal section. The black horizontal line marks the crypt–villus junction. (d)–(f) t = 6:00. The grey cells in (d) show a clone from one specific stem cell. The migration trajectories of this clone are shown in (e). The small black dot‐to‐dot distance equals 1 h. (f) shows a combined clone from four neighbouring stem cells.
Figure 3
Figure 3
The behaviour of the model crypt at different time points after a simulated mitotic block. (a) The vertical distribution of average cell‐to‐cell distances compared to the standard relaxed distance s. In steady state, cells in lower positions are more compressed than those in upper regions. 12 h later any mitotic activity has ceased and all distances are approximately equal. Vertical positions are measured as percentages of the total model crypt height. (b) For several hours after a mitotic block, at 0 h, cells still leave the crypt as a consequence of the relaxation process.
Figure 4
Figure 4
Positional labelling index data for 40 min (left panels: a, c, e) and 9 h (right panels: b, d, f) after 3HTdR labelling for different numbers of stem cells. (a, b) With 8 stem cells; (c, d) with 16 stem cells; (e, f) with 20 stem cells.
Figure 5
Figure 5
Run distributions comparing simulations with 16 stem cells for the experiment 40 min (a) and 9 h (b) after labelling.
Figure 6. Positional mitotic activity and cell velocity
(a) The positional mitotic index using 16 stem cells using a data set of 200 half‐crypt sections from four untreated mice killed at 15:00. (b) Migration velocity data in steady state, simulation versus experimental data. The velocities were calculated from the pLI data sets shown in Fig. 4c and d. The velocity calculations were performed in the way described in Qiu et al. (1994).

References

    1. Al‐Dewachi HS, Wright NA, Appleton DR, Watson AJ (1975) Cell population kinetics in the mouse jejunal crypt. Virchows. Arch. B. Cell. Pathol. 18, 225. - PubMed
    1. Al‐Dewachi HS, Appleton DR, Watson AJ, Wright NA (1979) Variation in the cell cycle time in the crypts of Lieberkuhn of the mouse. Virchows. Arch. B Cell Pathol. Incl. Mol. Pathol. 31, 37. - PubMed
    1. Bjerknes M & Cheng H (1999) Clonal analysis of mouse intestinal epithelial progenitors. Gastroenterology 116, 7. - PubMed
    1. Browder LW, Erickson CA, Jeffrey WR (1991) Developmental Biology, 3rd edn Philadelphia: Saunder College.
    1. Chwalinski S & Potten CS (1989) Crypt base columnar cells in ileum of BDF1 male mice–their numbers and some features of their proliferation. Am. J. Anat. 186, 397. - PubMed

Publication types

LinkOut - more resources