. 2001:2:12.
doi: 10.1186/1471-2156-2-12. Epub 2001 Aug 9.

Intraocular pressure in genetically distinct mice: an update and strain survey

Affiliations

Intraocular pressure in genetically distinct mice: an update and strain survey

O V Savinova et al. BMC Genet. 2001.

Erratum in

  • BMC Genet. 2001;2(1):16.

Abstract

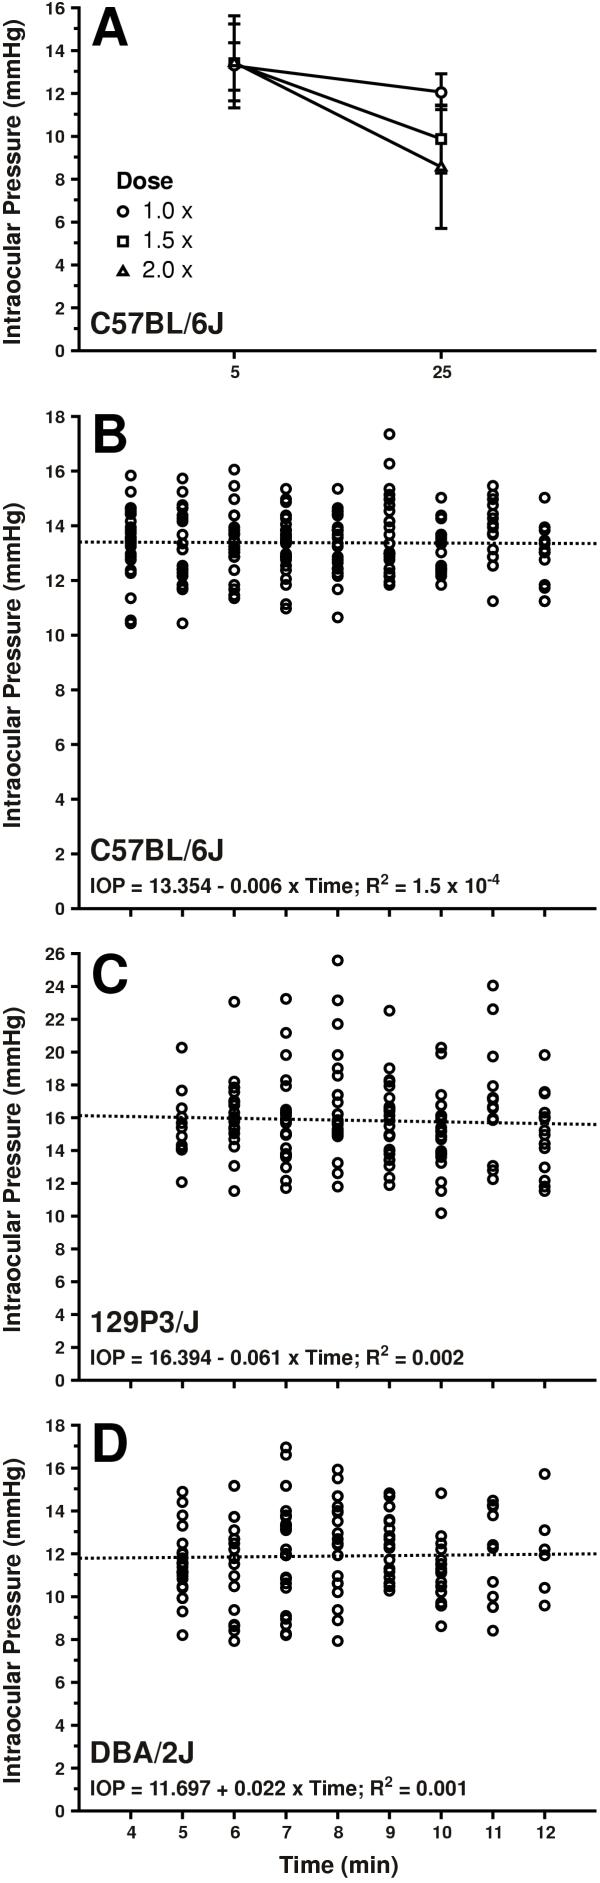
Background: Little is known about genetic factors affecting intraocular pressure (IOP) in mice and other mammals. The purpose of this study was to determine the IOPs of genetically distinct mouse strains, assess the effects of factors such as age, sex and time of day on IOP in specific strain backgrounds, and to assess the effects of specific candidate gene mutations on IOP.

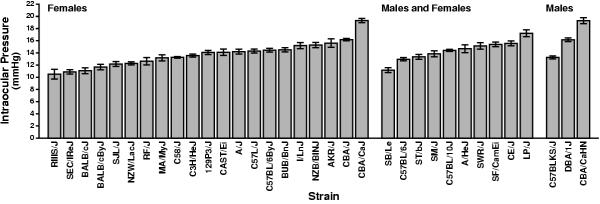
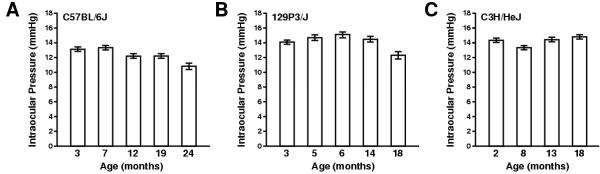
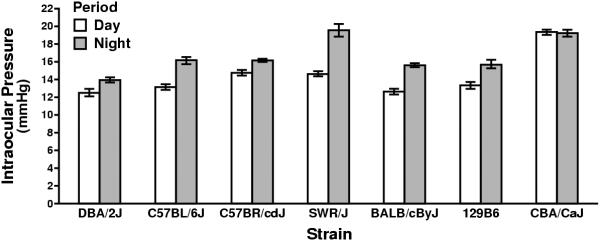
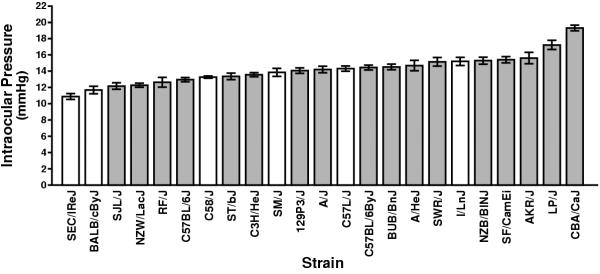
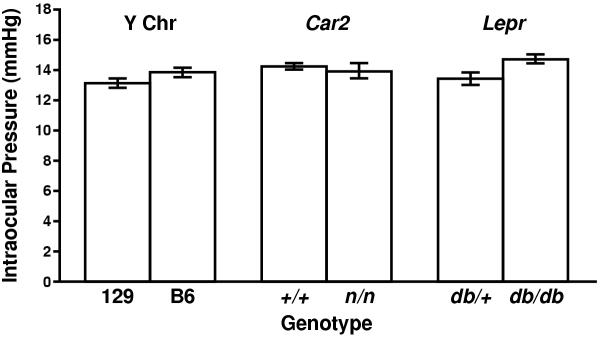
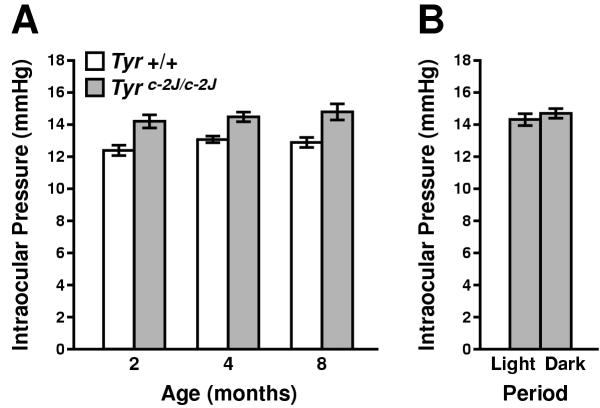
Results: Based on over 30 studied mouse strains, average IOP ranges from approximately 10 to 20 mmHg. Gender does not typically affect IOP and aging results in an IOP decrease in some strains. Most tested strains exhibit a diurnal rhythm with IOP being the highest during the dark period of the day. Homozygosity for a null allele of the carbonic anhydrase II gene (Car2n) does not alter IOP while homozygosity for a mutation in the leptin receptor gene (Leprdb) that causes obesity and diabetes results in increased IOP. Albino C57BL/6J mice homozygous for a tyrosinase mutation (Tyrc-2J) have higher IOPs than their pigmented counterparts.

Conclusions: Genetically distinct mouse strains housed in the same environment have a broad range of IOPs. These IOP differences are likely due to interstrain genetic differences that create a powerful resource for studying the regulation of IOP. Age, time of day, obesity and diabetes have effects on mouse IOP similar to those in humans and other species. Mutations in two of the assessed candidate genes (Lepr and Tyr) result in increased IOP. These studies demonstrate that mice are a practical and powerful experimental system to study the genetics of IOP regulation and disease processes that raise IOP to harmful levels.


Figures

Figure 1
Figure 1
An almost two-fold range of IOP between genetically distinct mouse strains. Mean IOP ± SEM is shown for each strain. Twelve to 25 mice were analyzed for each strain (typically 18 to 20), except for RIIIS/J (7 mice). Mice of most strains were 6 to 12 months old, except for SEC/1ReJ and SB/Le that were 2 to 3 months old. Approximately half of the CE/J and one third of the BUB/BnJ mice were 16 months old and were pooled with the younger mice, as the IOPs of both ages were the same. Strain name CBA/CaHN-Btkxid/J is abbreviated to CBA/CaHN.
Figure 2
Figure 2
Normal iridocorneal angles in strains with high and low IOP. The iridocorneal angle that contains the aqueous humor drainage structures (Schlemm's canal (SC) and trabecular meshwork (TM) had a normal morphology in strains CBA/CaJ (A, high IOP), BALB/cJ (B, low IOP) and all other strains. Pigment filled macrophages that resemble human clump cells were often located in the angle of CBA/CaJ mice but were never sufficient to block drainage. We have observed similar quantities of these cells at this location in other strains with lower IOP. The angle recess between the cornea (C) and iris root (I) was open and not occluded. Aqueous humor passes through this recess before entering the drainage structures. Original Magnification 630X.
Figure 3
Figure 3
The IOPs of different strains are stable and reproducible over time. Mean IOP ± SEM is shown for the indicated strain at different times of measurement. The measurement times within a single year were separated by a few months. The IOPs of strains that were analyzed multiple times in the same year are listed in the chronological order that they were obtained with the earliest measurement on left. The sex [Male (M) or Female (F)], age (months), and number of mice (n) analyzed for the CBA strains are listed starting with the earliest measurement and ending with the latest: CBA/CaJ, F, n = 22, age 6–7; M, n = 11, age 2; CBA/CaHN, F, n = 16, age 3; M, n = 8, age 3. For BALB/cJ and C57BL/6J, all groups were male and primarily 3 to 4 months old. The number of mice analyzed at each time follows: BALB/cJ 8, 10, 11, 15, 18 and 14, C57BL/6J 10, 14, 21,40,40 and 42. Strain name CBA/CaHN-Btkxid/J is abbreviated to CBA/CaHN.
Figure 4
Figure 4
IOP changes with increasing Age. Mean IOP ± SEM is shown for the indicated strain at different ages. IOP decreased significantly in strains C57BL/6J and 129P3/J but not C3H/HeJ. The C57BL/6J and 129P3/J groups consisted of approximately equal numbers of males and females. The 3 months old C3H/HeJ mice were male while the other ages were composed of males and females. The number of mice analyzed at each age, listed from youngest to oldest, follow: C57BL/6J, 18, 18, 18, 18, 13; 129P3/J, 18, 15, 16, 14, 21; C3H/HeJ, 15, 23 17 and 16.
Figure 5
Figure 5
No effect of 1X anesthetic dose within 12 minutes of administration. A Mean IOP ± SD is shown for C57BL/6J mice at 5 and 25 minutes after administration of various doses of anesthetic. The 1X dose consisted of 99 mg/kg ketamine and 9 mg/kg xylazine. All doses decreased IOP by 25 minutes. At all doses the IOP at 5 minutes was the same suggesting that the effect of anesthesia had not yet occurred. Approximately thirty 3 to 4 month old mice were analyzed at each dose and time B-D. Scatter-plots demonstrating no change in IOP over the 12 minutes following anesthetic administration in three relatively unrelated mouse strains. All strains consisted of males and females that ranged from 3 to 6 months of age. The sexes and ages were equally represented at each time point. The scatter-plots include 195 C57BL/6J, 161 129P3/J and 145 DBA/2J mice.
Figure 6
Figure 6
IOP is increased during the dark compared to light periods in several strains. Mean IOP ± SEM is shown for the indicated strains at measurement during the light (open bars) or dark (filled bars) periods of the day. All mice were 2 to 4 months old except for CBA/CaJ that were 5 to 6 months old. 129B6 refers to mice of a mixed 129X1/SvJ and C57BL/6J background. IOP was increased during the dark in all strains except CBA/CaJ. The number of mice successfully analyzed during the light (L) or dark (D) periods follows, DBA/2J 10L,10D; C57BL/6J 32L, 22D; C57BR/cdJ 12L,10D; SWR/J 16L, 16D; BALB/cByJ 15L, 16D; 129B6 10L, 12D; CBA/CaJ 22L, 16D.
Figure 7
Figure 7
No correlation between blood pressure and IOP. There is no strong correlation between the average systolic blood pressure of each strain and the average IOP of that strain (R2 = 0.1). All mice were female and 2 to 4 months old, with the exception that the female CBA/CaJ used for IOP assessment were 6 to 7 months old. If the CBA/CaJ mice are excluded, R2 drops to 0.01 of ARK/J, C57BL/6J and SJL/J, strain ARK/J had the lowest IOP.
Figure 8
Figure 8
Myoc alleles do not associate with IOP. Sequencing identified two alleles of Myoc in these mouse strains (see text). Mouse strains homozygous for an allele having a 12 bp insertion in the promoter region are shown as open bars and strains homozygous for the allele without this insertion have filled bars. The IOP data is the same as that in Figure 1.
Figure 9
Figure 9
Effects of genetic alterations. Mean IOP ± SEM is shown. There is no difference in IOP between 3 to 4 month old males with either the 129P2/Ola (n = 18) or C57BL/6J (n = 20) Y chromosome (Y Chr). The 129 Y Chr had been backcrossed to strain C57BL/6J for 11 generations. Similarly, 6 to 9 month old males and females that are homozygous for normal (+) or mutant (n) alleles of Car2 have similar IOPs (n = 18 and 14, respectively). However, 4 months old males homozygous for the Lepr diabetes and obesity causing mutation (db) had significantly higher IOPs than their heterozygous age and sex matched littermates. The average body weight of the homozygotes and heterozygotes was 59 g (range 50 to 64 g) and 35 g (range 28 to 41 g) respectively. Blood sugar levels in db /db males of this age are almost always in the diabetic range whereas those of heterozygotes are not [[27]]. This was recently confirmed in cohorts of approximately 25 males of each genotype (mean ± SD; db/db 422 ± 110 mg/dl ; db/+ 147 ± 19 mg/dl; Anthony Nicholson, The Jackson Laboratory, personal communication)
Figure 10
Figure 10
Tyr mutation results in increased IOP and altered diurnal changes A. Different cohorts of C57BL/6J mice that are homozygous for the spontaneous Tyrc-2J mutation have higher IOP than their normal counterparts at all tested ages. All groups consisted of male and female mice. B. IOP is not increased during the dark period of the day in Tyrc-2J homozygotes. The number of mice analyzed during the light period were: 2 month, 28 +/+, 29 c-2J/c-2J, 4 month, 20 +/+ and 20 c-2J/c-2J, 8 month, 15 +/+ and 15 c-2J/c-2J. Fourteen mice of each genotype were successfully analyzed during the dark period of the day.

Similar articles

Cited by

References

    1. Quigley HA. Number of people with glaucoma worldwide. Br J Ophthalmol. 1996;80:389–393. - PMC - PubMed
    1. Leske MC. The epidemiology of open-angle glaucoma: a review. Am J Epidemiol. 1983;118:166–191. - PubMed
    1. Ritch R, Shields MB, Krupin T. The Glaucomas, Clinical Science, 2nd edn St Louis, MO: Mosby-Year Book; 1996.
    1. Shields MB. Textbook of Glaucoma, Third edn Baltimore: Williams & Wilkins; 1992.
    1. Epstein DL, Allingham RR, Schuman JS. Chandler and Grant's Glaucoma, Fourth edn Baltimore, Maryland: Williams and Wilkins; 1997.

Publication types

MeSH terms

Substances

LinkOut - more resources