. 2001 Sep 1;535(Pt 2):427-43.
doi: 10.1111/j.1469-7793.2001.00427.x.

Open probability of homomeric murine 5-HT3A serotonin receptors depends on subunit occupancy

Affiliations

Open probability of homomeric murine 5-HT3A serotonin receptors depends on subunit occupancy

D D Mott et al. J Physiol. .

Abstract

1. The time course of macroscopic current responses of homomeric murine serotonin 5-HT3A receptors was studied in whole cells and excised membrane patches under voltage clamp in response to rapid application of serotonin. 2. Serotonin activated whole cell currents with an EC(50) value for the peak response of 2 microM and a Hill slope of 3.0 (n = 12), suggesting that the binding of at least three agonist molecules is required to open the channel. 3. Homomeric 5-HT3A receptors in excised membrane patches had a slow activation time course (mean +/- S.E.M. 10-90 % rise time 12.5 +/- 1.6 ms; n = 9 patches) for 100 microM serotonin. The apparent activation rate was estimated by fitting an exponential function to the rising phase of responses to supramaximal serotonin to be 136 s(-1). 4. The 5-HT3A receptor response to 100 microM serotonin in outside-out patches (n = 19) and whole cells (n = 41) desensitized with a variable rate that accelerated throughout the experiment. The time course for desensitization was described by two exponential components (for patches tau(slow) 1006 +/- 139 ms, amplitude 31 %; tau(fast) 176 +/- 25 ms, amplitude 69 %). 5. Deactivation of the response following serotonin removal from excised membrane patches (n = 8) and whole cells (n = 29) was described by a dual exponential time course with time constants similar to those for desensitization (for patches tau(slow) 838 +/- 217 ms, 55 % amplitude; tau(fast) 213 +/- 44 ms, 45 % amplitude). 6. In most patches (6 of 8), the deactivation time course in response to a brief 1-5 ms pulse of serotonin was similar to or slower than desensitization. This suggests that the continued presence of agonist can induce desensitization with a similar or more rapid time course than agonist unbinding. The difference between the time course for deactivation and desensitization was voltage independent over the range -100 to -40 mV in patches (n = 4) and -100 to +50 mV in whole cells (n = 4), suggesting desensitization of these receptors in the presence of serotonin does not reflect a voltage-dependent block of the channel by agonist. 7. Simultaneously fitting the macroscopic 5-HT3A receptor responses in patches to submaximal (2 microM) and maximal (100 microM) concentrations of serotonin to a variety of state models suggests that homomeric 5-HT3A receptors require the binding of three agonists to open and possess a peak open probability greater than 0.8. Our modelling also suggests that channel open probability varies with the number of serotonin molecules bound to the receptor, with a reduced open probability for fully liganded receptors. Increasing the desensitization rate constants in this model can generate desensitization that is more rapid than deactivation, as observed in a subpopulation of our patches.


Figures

Figure 1
Figure 1. Activation of 5-HT3A receptors by serotonin
A, the upper panel shows whole cell currents recorded from an HEK cell stably expressing 5-HT3A receptors in response to application of different concentrations of serotonin (-100 mV); bar shows period of agonist application. The lower panel shows normalized current responses to three different concentrations of serotonin. B, dose-response relationship is shown for serotonin activation of 5-HT3A receptors. ○, mean ±s.e.m. from 12 cells; ▵, data from patches (n = 3). Continuous line is from eqn (4) fitted to the whole cell data.
Figure 2
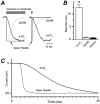
Figure 2. The rise time of the 5-HT3A current responses in excised patches
A, current recordings are shown from an outside-out membrane patch from an HEK 293 cell that was stably transfected with 5-HT3A cDNA and transiently transfected with GluR6(Q) cDNA. In the left panel a 5 s application of serotonin (100 μm or 50 × EC50) produces an inward current at -80 mV with a 10-90 % rise time of 13.7 ms. In this same patch application of 10 mm glutamate (20 × EC50) for an equivalent duration produces an inward current (dashed line) which rises faster than the response to serotonin. In the right panel application of serotonin to this same patch for 1 ms produces a current with similar rising time course to that produced by the 5 s agonist pulse; a 1 ms pulse of glutamate produced a GluR6-mediated current response with faster kinetics. In order to evaluate the agonist application time course, the open pipette junction current (labelled ‘open pipette’) was recorded after the patch was ruptured. B, averaged values for the 10 -90 % rise time of serotonin- and glutamate-induced currents recorded from excised patches (n = 5) exposed to 5 s pulses of 100 μm serotonin. Asterisk (*) indicates that the 5-HT3 current rose significantly more slowly than the GluR6(Q) current (P < 0.001; paired t test,). C, mean current response (dotted line) and open tip potential (continuous line) from three patches exposed to 5 s application of 100 μm serotonin are superimposed. Traces were aligned on the point of steepest rise of the open tip potential.
Figure 3
Figure 3. Time course of desensitization
A, the onset of serotonin-induced desensitization in a current recording from an excised patch is best described by two exponential components. The thin white curve shows the fitted dual exponential time course. B, the mean ±s.e.m.τfast and τslow describing serotonin-induced desensitization of patch (□) and whole cell (formula image) current responses are shown. C, averaged amplitude ratios (mean ±s.e.m.) obtained using a double pulse protocol (see inset) show the time course of recovery from serotonin-induced desensitization (τrecovery;n = 12 cells). The continuous line shows the fit of eqn (2) to the data. The time course was best fitted by a single exponential component (ND = 1.1).
Figure 4
Figure 4. Time course of deactivation
A, the deactivation time course of a current response evoked by a brief application of serotonin (3 ms) to the same excised patch shown in Fig. 3. The thin white curve shows the fitted dual exponential time course. B, the mean ±s.e.m.τfast and τslow describing deactivation of serotonin-induced responses in patch (□) and whole cell (formula image) current responses are shown. C, averaged amplitude ratios (mean ±s.e.m.) obtained using a double pulse protocol (see inset) show the time course of recovery from desensitization of whole cell current responses induced by a brief application (1-5 ms) of serotonin (n = 9 cells). The continuous line shows the fit of eqn (2) to the data. The time course was best fitted by a single exponential component with ND= 1.0 (from eqn (2)). For comparison, the recovery time course from desensitization caused by prolonged agonist application in these same cells is superimposed as a dashed line.
Figure 5
Figure 5. Variable time course for 5-HT3A desensitization
A, each circle represents the τfast (left panel) or τslow (right panel) value for either desensitization (▪) or deactivation (□) from serotonin-evoked whole cell currents. The bars show the mean fitted time constants ±s.e.m.B and C, histograms compare for τslow (B) and τfast (C) the distribution of desensitization time constants (▪) to the distribution of deactivation time constants (□).
Figure 6
Figure 6. Rapid desensitization of 5-HT3A receptors
A, current recordings of 100 μm serotonin-evoked current in an excised outside-out patch from an HEK 293 cell are shown. Responses of similar amplitudes were evoked by brief (1-5 ms, lower panel, thick traces) and long (5 s, lower panel, thin traces) duration applications of agonist. The junction potential changes (labelled ‘open pipette’) in response to brief (upper panel, top trace) and long duration (upper panel, bottom trace) agonist application are shown for this patch. B, application of serotonin for an intermediate duration (1 s in this patch; thick trace) evoked a response that initially declined in amplitude with a time course identical to desensitization induced by 5 s application of serotonin (thin trace). After removal of the agonist (circled area), the decay immediately becomes slower with a time course similar to the decay for a 1-5 ms pulse (thin trace). C, the I-V relationship for whole cell currents (corrected for the junction potential) in response to serotonin application for 1-5 ms and 5 s is shown in the left panel. Each I-V curve represents the average of 5 trials from the same cell. The right panel shows whole cell responses to 1-5 ms and 5 s pulses of serotonin at -80 and +60 mV. At both potentials the onset of desensitization was faster than that of deactivation in this cell. D, the half-width of the response to a 5 s application of serotonin (desensitization) was expressed as a fraction of the half-width of the response to 1-5 ms pulse (deactivation) for cells (○) and patches (•). This ratio changed only minimally over the tested voltage range.
Figure 7
Figure 7. A model of murine homomeric 5-HT3A receptor activation
A, hypothetical binding scheme for a homo-pentameric receptor with five equivalent agonist binding sites. States and transitions shown with dotted arrows were not included in the fitting procedure, but are presumed to exist on the basis of published or experimental data (see text). Transitions shown as open-headed arrows were not varied as free parameters in the fitting procedure. The unbinding rate constants for the desensitized states were adjusted to maintain microscopic reversibility of cyclic portions of the model. Asterisks indicate open states. B, two different sets of rate constants were identified from fitting this model simultaneously to averaged current waveforms recorded in response to 2 and 100 μm serotonin applied to the same patch. C-E, the concentration dependence of peak current (continuous line; Fig. 1), rise time (□, continuous line), and half-width (□, continuous line) are shown for experimental whole cell currents (n = 12) and for the two sets of rate constants determined from fitting our model to patch data (▵, ▿). Although the fitted rate constants produce response waveforms that described experimental data from patches well (*), there was some divergence between the simulated and measured half-width from whole cell responses (E), consistent with our observation of different kinetics in patch vs. whole cell recordings. Error bars are s.e.m.
Figure 8
Figure 8. Comparison of predicted and recorded macroscopic homomeric 5-HT3A response waveforms
A, thick black traces show the averaged current waveforms recorded from excised membrane patches (n = 3) in response to prolonged (5 s) application of 2 or 100 μm serotonin. These waveforms were used in the fitting of the model in Fig. 7A. The predicted response waveforms from the fitted rate constants for Fit 1 (Fig. 7B) are superimposed as thin white lines. B and C, the time course of the open probabilities predicted from the rate constants for Fit 1 for receptors with 3, 4 or 5 serotonin molecules bound is shown for simulated responses to 100 μm (B) and 2 μm serotonin (C). The inset shows the maximum fraction of open receptors calculated in a manner independent of subunit occupancy from: where n is the number of agonist molecules bound from the model shown in Fig. 7. Note the dependence of the peak open probability on the number of agonist-bound subunits. Similar dependence of open probability on the number of agonist-bound subunits was observed for the rate constants for Fit 2 (data not shown).
Figure 9
Figure 9. A model of rapid desensitization of murine homomeric 5-HT3A receptors
A, hypothetical binding scheme for a pentameric receptor with five equivalent agonist binding sites. The left panel shows the summed occupancy of receptors that have bound 3, 4, or 5 agonist molecules in response to a 2 or 50 ms application of 100 μm agonist. Note that the probability of reaching states with 3, 4, or 5 ligands bound is similar for both agonist stimulation protocols. However, brief application of agonist does not result in a large fraction of fully liganded receptors, but rather has similar proportions of receptors with 3, 4 and 5 agonist molecules bound during and following the agonist pulse (centre panel). By contrast, longer duration of agonist drives most receptors into the fully liganded state (right panel). Grey lines show the summed probability of having 3, 4, or 5 agonist molecules bound. B, serotonin-induced current responses from a subset (4 of 8) of excised membrane patches (n = 4) that showed desensitization that was more rapid than deactivation were averaged by aligning the waveforms on the rise of the measured junction potential. The averaged responses to 3 ms and 5 s application of 100 μm serotonin (points) were fitted to the model shown in Fig. 7A. The smooth lines show waveforms predicted by fitting the model from Fig. 7A, varying only the rate of desensitization. C, fitted rate constants for Fit 1 from Fig. 7 are shown in the left column. The right column shows the fitted result to the curves in B when the binding and channel opening rate constants were fixed equal to those determined for Fit 1 (Fig. 7B) and the rate constants describing the onset of desensitization were allowed to vary in the fitting routine. Thus, the model shown in Fig. 7, which predicts similar deactivation and desensitization (not shown), can be converted into a model showing more rapid desensitization simply by increasing the desensitization rate constants (shown in the box) for receptors with agonist occupancy of all subunits. Other satisfactory fits to the data presented in B can be obtained by changing any combination of rate constants so that desensitization of receptors with 4 or 5 agonists bound is increased (not shown).

Similar articles

Cited by

References

    1. Aapro MS. Controlling emesis related to cancer therapy. European Journal of Cancer. 1991;27:356–361. - PubMed
    1. Adams PR. Drug blockade of open end-plate channels. Journal of Physiology. 1976;260:531–552. - PMC - PubMed
    1. Armstrong CM. Interaction of tretraethylammonium ion derivatives with the potassium channels of giant axons. Journal of General Physiology. 1971;58:413–437. - PMC - PubMed
    1. Banke TG, Bowie D, Lee H-K, Huganir RL, Schousboe A, Traynelis SF. Control of GluR1 AMPA receptor function by cAMP-dependent protein kinase. Journal of Neuroscience. 2000;20:89–102. - PMC - PubMed
    1. Barann M, Gothert M, Binisch H, Dybek A, Urban BW. 5-HT3 receptors in outside-out patches of N1E-115 neuroblastoma cells: basic properties and effects of pentobarbital. Neuropharmacology. 1997;36:655–664. - PubMed

Publication types

LinkOut - more resources