. 2001 Oct;75(19):9142-55.
doi: 10.1128/JVI.75.19.9142-9155.2001.

Induction of p53-independent apoptosis by simian virus 40 small t antigen

Affiliations

Induction of p53-independent apoptosis by simian virus 40 small t antigen

O Gjoerup et al. J Virol. 2001 Oct.

Abstract

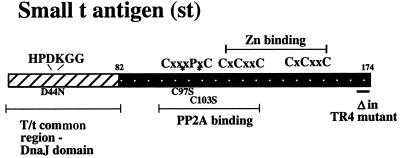
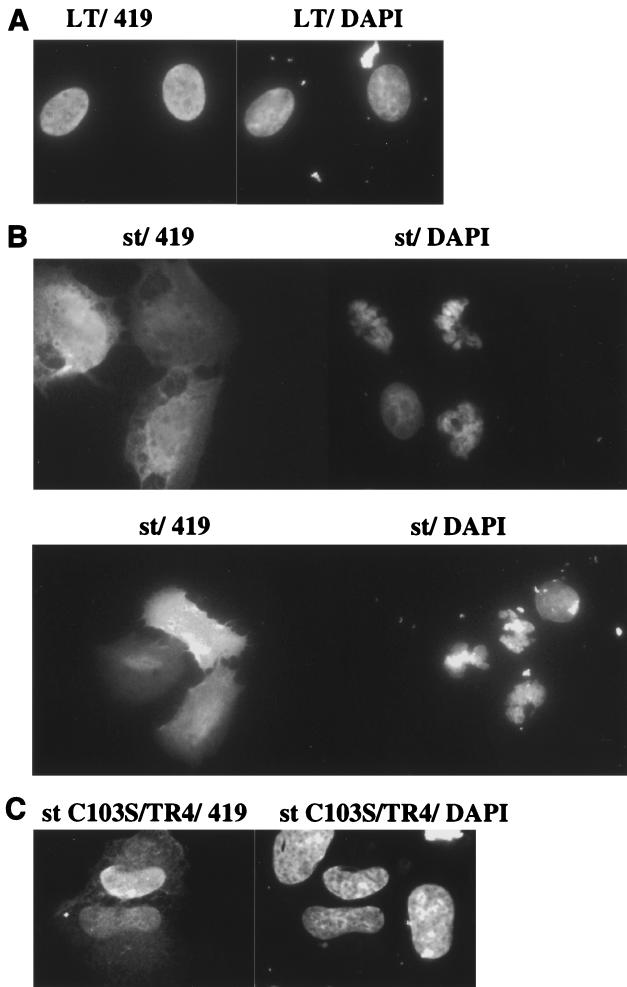
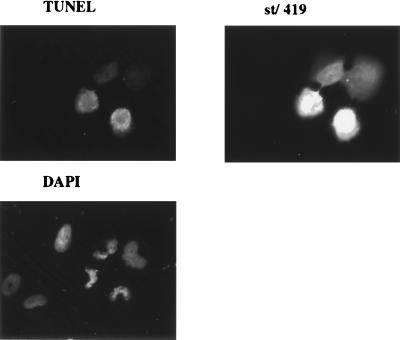
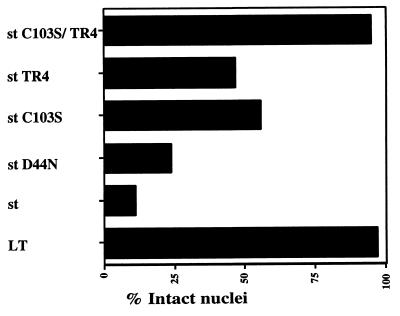
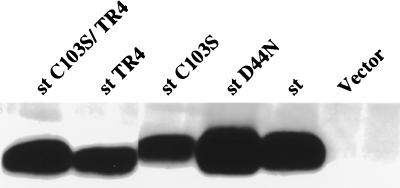
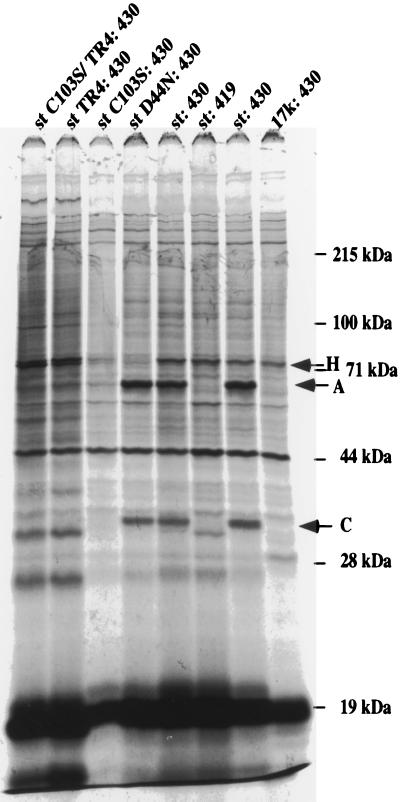
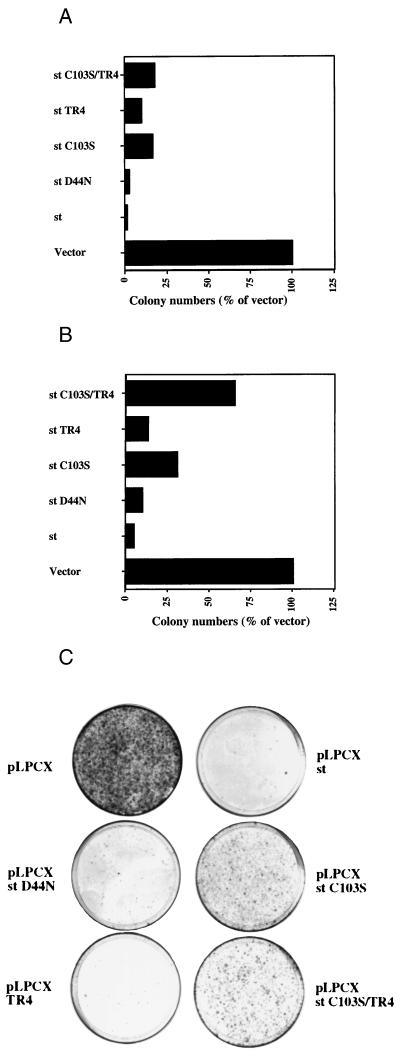
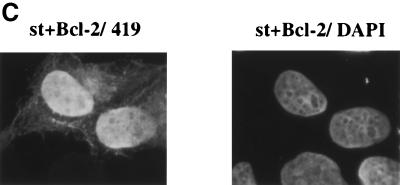
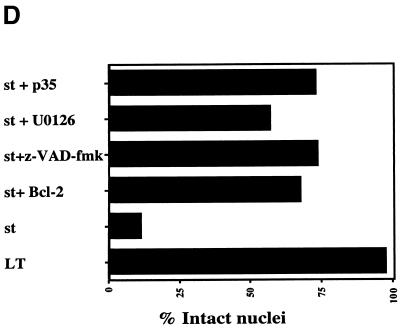
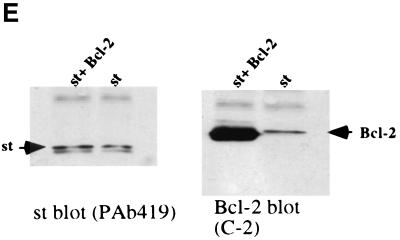
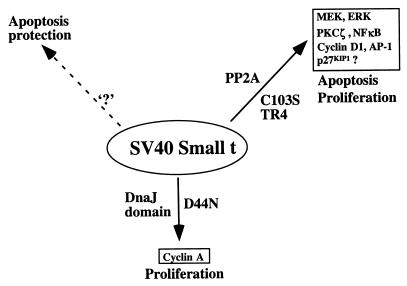
Simian virus 40 small t antigen (st) is required for optimal transformation and replication properties of the virus. We find that in certain cell types, such as the human osteosarcoma cell line U2OS, st is capable of inducing apoptosis, as evidenced by a fragmented nuclear morphology and positive terminal deoxynucleotidyltransferase-mediated dUTP nick end labeling staining of transfected cells. The cell death can be p53 independent, since it also occurs in p53-deficient H1299 cells. Genetic analysis indicates that two specific mutants affect apoptosis induction. One of these (C103S) has been frequently used as a PP2A binding mutant. The second mutant (TR4) lacks the final four amino acids of st, which have been reported to be unimportant for PP2A binding in vitro. However, TR4 unexpectedly fails to bind PP2A in vivo. Furthermore, a long-term colony assay reveals a potent colony inhibition upon st expression, and the behavior of st mutants in this assay reflects the relative frequency of nuclear fragmentation observed in transfections using the same mutants. Notably, either Bcl-2 coexpression or broad caspase inhibitor treatment could restore normal nuclear morphology. Finally, fluorescence-activated cell sorting analysis suggests a correlation between the ability of st to modulate cell cycle progression and apoptosis. Taken together, these observations underscore that st does not always promote proliferation but may, depending on conditions and cell type, effect a cell death response.


Figures

FIG. 1
FIG. 1
Schematic drawing of st features. This diagram outlines the salient features of SV40 st. The first 82 amino acids of st constitute the first exon and are shared with LT. Previous work has demonstrated that this region contains a bona fide DnaJ domain capable of binding Hsc70, depending on an intact HPDK motif (, , ; Kelley and Landry, letter). One frequently used mutant, D44N, disables DnaJ domain function (11). The central region of st appears to contain the major binding determinants for PP2A (42, 48, 72). Two frequently used PP2A binding-deficient mutants, C97S and C103S, are indicated (48). Furthermore, the diagram depicts two cysteine clusters responsible for binding Zn. Also indicated is the TR4 mutant lacking the final four amino acids of st.
FIG. 2
FIG. 2
St, but not LT, induces apoptosis in U2OS cells. (A) U2OS cells seeded on Chamberslides were transiently transfected with a pCMV LT expression vector and processed for immunofluorescence staining with PAb419 antibody (left panel). The right panel outlines the nucleus after visualization of the DNA with DAPI. Note the preserved integrity of the nucleus, thus showing no signs of cell death. (B) U2OS cells were transfected as for panel A but with a pSG5 st expression vector. The left panel shows staining for st expression with PAb419 (two different fields), and the right one demonstrates DAPI staining of the cells in the same field. Strikingly, the st-expressing cells have a nuclear morphology very different from that of the nontransfected cell. The cells with fragmented nuclei show signs of cell death by apoptosis. (C) U2OS cells were transfected as for panel A but with the pSG5 st C103S/TR4 expression vector. The left panel shows staining for the st C103S/TR4 protein, and the right panel shows the DAPI staining of the same field. Interestingly, the nuclei are preserved, in contrast with the nuclei of wild-type st-expressing cells. Also note the predominantly nuclear localization pattern of this double mutant.
FIG. 3
FIG. 3
U2OS cells expressing st undergo apoptosis as determined by TUNEL. U2OS cells were transfected, as described for Fig. 2B, with the pSG5 st expression vector. The cells were subsequently processed for TUNEL (Promega) to detect the fragmented nucleosomal DNA ends indicative of apoptosis. Finally, the cells were processed for st immunofluorescence to identify the successfully transfected cells and DAPI to visualize the DNA.
FIG. 4
FIG. 4
Quantitative analysis of cell death induction by st mutants as measured by nuclear fragmentation. U2OS cell were transfected as described for Fig. 2B with an expression vector encoding either wild-type st or the mutant indicated. Immunofluorescence staining for st and DAPI staining of the DNA were performed. Every cell that expressed the desired mutant was counted as having either a damaged or an intact nucleus based on DAPI visualization of the nuclear morphology. The graph contains data from a minimum of two independent experiments (for some mutants more than two), and in each experiment 100 positive (expressing) cells were scored. Finally, the data were averaged and plotted as the percentage of cells with intact nuclei. LT was used as a negative control, since it did not affect nuclear integrity in U2OS cells.
FIG. 5
FIG. 5
Western blot analysis after transient expression of wild-type st and mutants in U2OS cells. Wild-type st and mutant st expression vectors were transfected into U2OS cells, and then lysates were prepared and assayed for st expression by Western blotting using the PAb419 antibody. Notice the slightly faster mobility of the truncation mutants st TR4 and st C103S/TR4.
FIG. 6
FIG. 6
Interaction of st mutants with PP2A in vivo. Wild-type or mutant st expression vectors and a 17k expression plasmid were each transfected into U2OS cells. At 48 h posttransfection, the transfected cells were metabolically labeled with [35S]methionine for 4 h, after which the cells were lysed and the lysates were immunoprecipitated with PAb430 antibody. The thoroughly washed immunoprecipitates were analyzed on an SDS–12% polyacrylamide gel. For comparison, an immunoprecipitation performed using PAb419 was included; this antibody fails to bring down the st-PP2A complex. Arrows with letters indicate the bands representing the 63-kDA A subunit and the 36-kDa C subunit of PP2A. Furthermore, an arrow indicates the band corresponding to Hsc70 (labeled H).
FIG. 7
FIG. 7
Suppression of colony formation by st and mutants. (A) U2OS cells were transfected with either the pLPCX (Clontech) parental vector or the pLPCX vector directing expression of st or its mutants. After approximately 2 weeks of selection for puromycin resistance (encoded on the pLPCX plasmid), individual drug-resistant colonies appeared. These colonies were visualized by crystal violet staining and counted. For each experiment, the number of colonies was normalized to that obtained with the pLPCX vector alone and plotted in this graph as a percentage of vector value. For most of the mutants at least five independent experiments were conducted, but for the st C103S/TR4 mutant the graph represents data from two independent experiments. (B) A colony assay was performed as outlined in the legend to panel A but with H1299 cells, which are p53 deficient. The colony numbers were once again normalized to that obtained with the pLPCX vector alone and plotted in the graph as percentages. (C) A typical H1299-based colony assay conducted as described in the legend to panel B is shown. Note the dramatic reduction in colony-forming potential upon st expression, probably due to a cell death response.
FIG. 8
FIG. 8
Failure of st to induce apoptosis in CV1-P cells. The monkey kidney cell line CV1-P was transfected as outlined in the legend to Fig. 2. Cell staining with PAb419 was carried out to visualize st expression (right panel), and DAPI staining was done for visualization of the nuclear morphology (left panel). In contrast to U2OS cells (Fig. 2), the transfected CV1-P cells expressing st have largely intact nuclear morphology.
FIG. 9
FIG. 9
Protection from apoptosis by Bcl-2, caspase inhibitor, or MEK inhibitor. (A) U2OS cells were transfected with the pIRES2 EGFP-st vector, which expresses st bicistronically with EGFP as a marker (left panel). The right panel shows staining of the same field of cells with Hoechst 33258, thus visualizing cellular DNA. Note the rounded shape of st-expressing cells (left panel) as well as the condensed chromatin (right panel). (B) U2OS cells were transfected with pIRES2 EGFP-st either alone (left panel) or together with a CMV Bcl-2 expression vector in a 1:4 ratio (right panel). The rounded shape of dying cells is reversed by Bcl-2 coexpression to resemble normal cell shape. (C) U2OS cells were cotransfected with pSG5 st and CMV Bcl-2 in a 1:4 ratio. Subsequently, the cells were stained for st with PAb419 and with DAPI to visualize the DNA as described in the legend to Fig. 2A. Note the intact nuclear morphology, in comparison to Fig. 2B. (D) U2OS cells were transfected with st alone or, alternatively, coexpressed with either Bcl-2 or the broad caspase inhibitor p35. In some instances, the st-transfected cells were treated with potential modulators of apoptosis such as the broad caspase inhibitor z-VAD-Fmk (50 μM) or the MEK inhibitor U0126 (10 μM), and results were compared to that obtained with vehicle (DMSO) alone. Transfected cells expressing st were identified by cell staining with PAb419, and nuclear morphology was assessed as intact or disrupted. The percentage of disrupted nuclei was plotted in the graph and compared to that obtained with LT (negative control). At least two independent experiments, each time counting 100 st-expressing cells, were conducted; for some of the combinations several more experiments were performed. Average values are displayed in the graph. (E) U2OS cells transfected with either 1 μg of st vector plus 4 μg pcDNA3 vector or 1 μg of st vector plus 4 μg of pCMV Bcl-2 were lysed after 48 h and assayed by Western blotting for st expression using the PAb419 antibody. In the right panel, the same samples were analyzed for Bcl-2 expression using a Bcl-2 monoclonal antibody.
FIG. 9
FIG. 9
Protection from apoptosis by Bcl-2, caspase inhibitor, or MEK inhibitor. (A) U2OS cells were transfected with the pIRES2 EGFP-st vector, which expresses st bicistronically with EGFP as a marker (left panel). The right panel shows staining of the same field of cells with Hoechst 33258, thus visualizing cellular DNA. Note the rounded shape of st-expressing cells (left panel) as well as the condensed chromatin (right panel). (B) U2OS cells were transfected with pIRES2 EGFP-st either alone (left panel) or together with a CMV Bcl-2 expression vector in a 1:4 ratio (right panel). The rounded shape of dying cells is reversed by Bcl-2 coexpression to resemble normal cell shape. (C) U2OS cells were cotransfected with pSG5 st and CMV Bcl-2 in a 1:4 ratio. Subsequently, the cells were stained for st with PAb419 and with DAPI to visualize the DNA as described in the legend to Fig. 2A. Note the intact nuclear morphology, in comparison to Fig. 2B. (D) U2OS cells were transfected with st alone or, alternatively, coexpressed with either Bcl-2 or the broad caspase inhibitor p35. In some instances, the st-transfected cells were treated with potential modulators of apoptosis such as the broad caspase inhibitor z-VAD-Fmk (50 μM) or the MEK inhibitor U0126 (10 μM), and results were compared to that obtained with vehicle (DMSO) alone. Transfected cells expressing st were identified by cell staining with PAb419, and nuclear morphology was assessed as intact or disrupted. The percentage of disrupted nuclei was plotted in the graph and compared to that obtained with LT (negative control). At least two independent experiments, each time counting 100 st-expressing cells, were conducted; for some of the combinations several more experiments were performed. Average values are displayed in the graph. (E) U2OS cells transfected with either 1 μg of st vector plus 4 μg pcDNA3 vector or 1 μg of st vector plus 4 μg of pCMV Bcl-2 were lysed after 48 h and assayed by Western blotting for st expression using the PAb419 antibody. In the right panel, the same samples were analyzed for Bcl-2 expression using a Bcl-2 monoclonal antibody.
FIG. 10
FIG. 10
Schematic overview of st activities in proliferation and apoptosis. This figure attempts to summarize what we currently know about activities of st involved in proliferation and apoptosis. The binding and inhibition of PP2A by st can affect both proliferation and apoptosis. Indeed, there are reports that it is required for the st helper function in oncogenic transformation (29, 48, 55). This may in part be mediated by activation of the MEK/ERK, PKCζ/NF-κB, cyclin D1, and AP1 pathways and down-regulation of p27 KIP1 (25, 56, 72, 73, 83). This report suggests that st activation of the MEK/ERK pathways also under some conditions may be involved in promoting the apoptotic response, since the MEK1 inhibitor partially protects. The DnaJ domain of st has been previously implicated in cyclin A promoter activation as well as transformer helper function, at least under certain conditions (55). We did not find a functional DnaJ domain to contribute significantly to the cell death response elicited by st. Finally, we surmise, based on published evidence, the existence of an activity in st conferring increased survival in certain contexts (5, 33). This function is indicated by ‘?,’ since we do not know if it represents a novel function or, alternatively, if one of the known functions under specific conditions may effect a cellular survival response.

Similar articles

Cited by

References

    1. Ayyavoo V, Mahboubi A, Mahalingam S, Ramalingam R, Kudchodkar S, Williams W V, Green D R, Weiner D B. HIV-1 Vpr suppresses immune activation and apoptosis through regulation of nuclear factor kappa B. Nat Med. 1997;3:1117–1123. - PubMed
    1. Banks L, Edmonds C, Vousden K H. Ability of the HPV16 E7 protein to bind RB and induce DNA synthesis is not sufficient for efficient transforming activity in NIH3T3 cells. Oncogene. 1990;5:1383–1389. - PubMed
    1. Bartz S R, Emerman M. Human immunodeficiency virus type 1 Tat induces apoptosis and increases sensitivity to apoptotic signals by up-regulating FLICE/caspase-8. J Virol. 1999;73:1956–1963. - PMC - PubMed
    1. Bergqvist A, Magnusson G. Apoptosis of Spodoptera frugiperda cells induced by okadaic acid is abrogated by baculovirus infection. Exp Cell Res. 1994;215:223–227. - PubMed
    1. Bergqvist A, Soderbarg K, Magnusson G. Altered susceptibility to tumor necrosis factor alpha-induced apoptosis of mouse cells expressing polyomavirus middle and small T antigens. J Virol. 1997;71:276–283. - PMC - PubMed

Publication types

MeSH terms

Substances