

doi: 10.1128/JVI.75.19.9543-9548.2001.
Analysis of Mason-Pfizer monkey virus Gag particles by scanning transmission electron microscopy
Affiliations
- PMID: 11533218
- PMCID: PMC114523
- DOI: 10.1128/JVI.75.19.9543-9548.2001
Item in Clipboard
Analysis of Mason-Pfizer monkey virus Gag particles by scanning transmission electron microscopy
J Virol.
2001 Oct.
Abstract
Mason-Pfizer monkey virus immature capsids selected from the cytoplasm of baculovirus-infected cells were imaged by scanning transmission electron microscopy. The masses of individual selected Gag particles were measured, and the average mass corresponded to 1,900 to 2,100 Gag polyproteins per particle. A large variation in Gag particle mass was observed within each population measured.
Figures
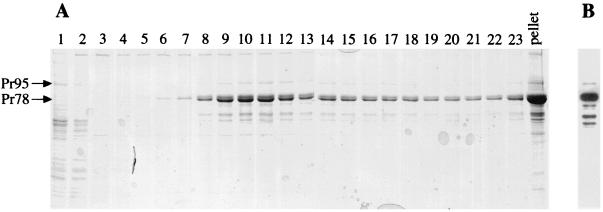
SDS-PAGE of velocity gradient fractions during the purification of M-PMV Gag particles. (A) Pr78Gag and Pr95Gag-Pro are shown in a Coomassie blue-stained gel with each fraction labeled from top (fraction 1) to bottom (fraction 23). The results for the resuspension of the pellet at the bottom of the tube is also shown (lane labeled “pellet”). (B) Western blot of an SDS-PAGE gel (using one gradient fraction containing Gag particles) with anti-Gag antiserum demonstrates that all major bands in the gel are Gag-related products.
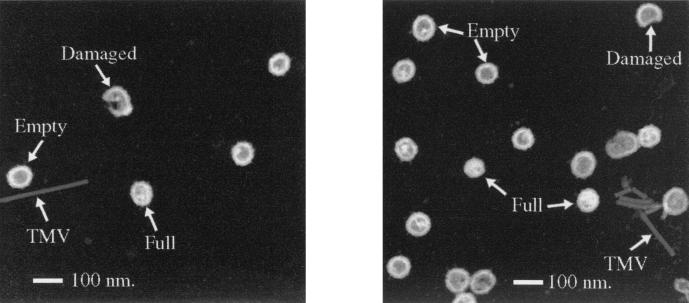
STEM images. Two representative dark-field STEM images that depict the complete Gag particles (full and empty) and damaged or incomplete particles found during image analysis are shown. TMV is also shown as an internal control for mass measurements.
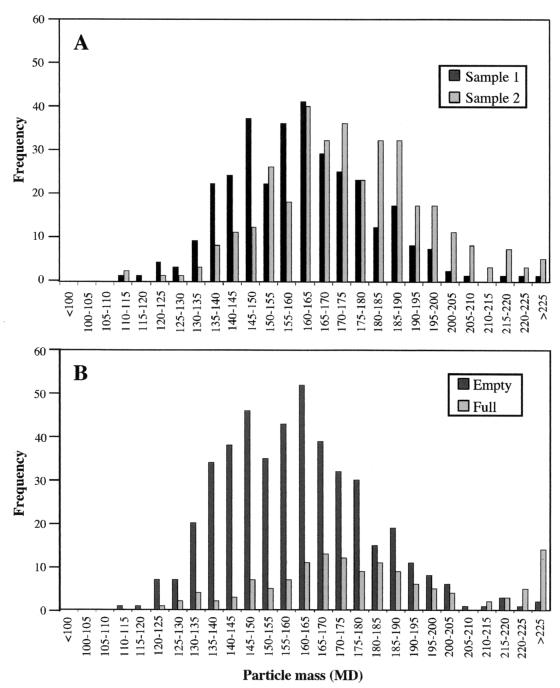
Distribution of particle mass. (A) Particle frequency is plotted versus particle mass (in megadaltons) for all particles used for mass measurements from gradient fractions 8 through 12 from two independent samples. These data were used in the calculation of the average mass for M-PMV Gag particles. (B) Particle frequency is plotted as a function of particle mass for both empty and full particles found within velocity gradient fractions 8 through 18 from sample 1.
References
-
- Barklis E, McDermott J, Wilkens S, Fuller S, Thompson D. Organization of HIV-1 capsid proteins on a lipid monolayer. J Biol Chem. 1998;273:7177–7180. - PubMed
-
- Berkowitz R, Fisher J, Goff S P. RNA packaging. Curr Top Microbiol Immunol. 1996;214:177–218. - PubMed
-
- Bishop J M, Levinson W E, Quintrell N, Sullivan D, Fanshier L, Jackson J. The low molecular weight RNAs of Rous sarcoma virus. I. The 4S RNA. Virology. 1970;42:182–195. - PubMed
Publication types
MeSH terms
Substances
Grants and funding
LinkOut - more resources
Full Text Sources
