. 2001 Oct;21(19):6369-86.
doi: 10.1128/MCB.21.19.6369-6386.2001.

Interferon regulatory factor 4 contributes to transformation of v-Rel-expressing fibroblasts

Affiliations

Interferon regulatory factor 4 contributes to transformation of v-Rel-expressing fibroblasts

R Hrdlicková et al. Mol Cell Biol. 2001 Oct.

Abstract

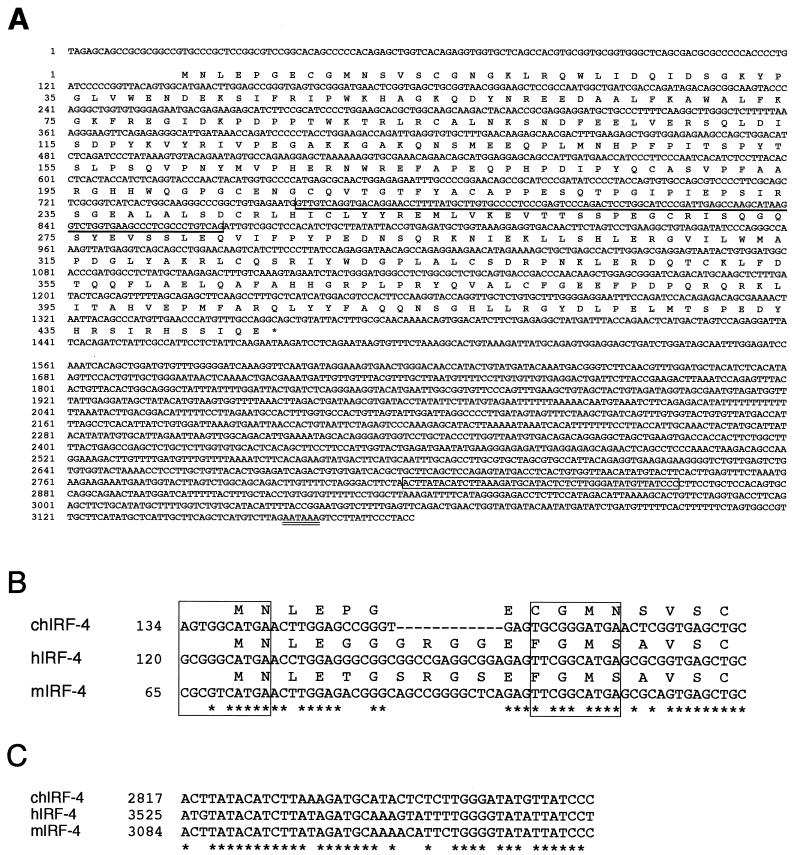
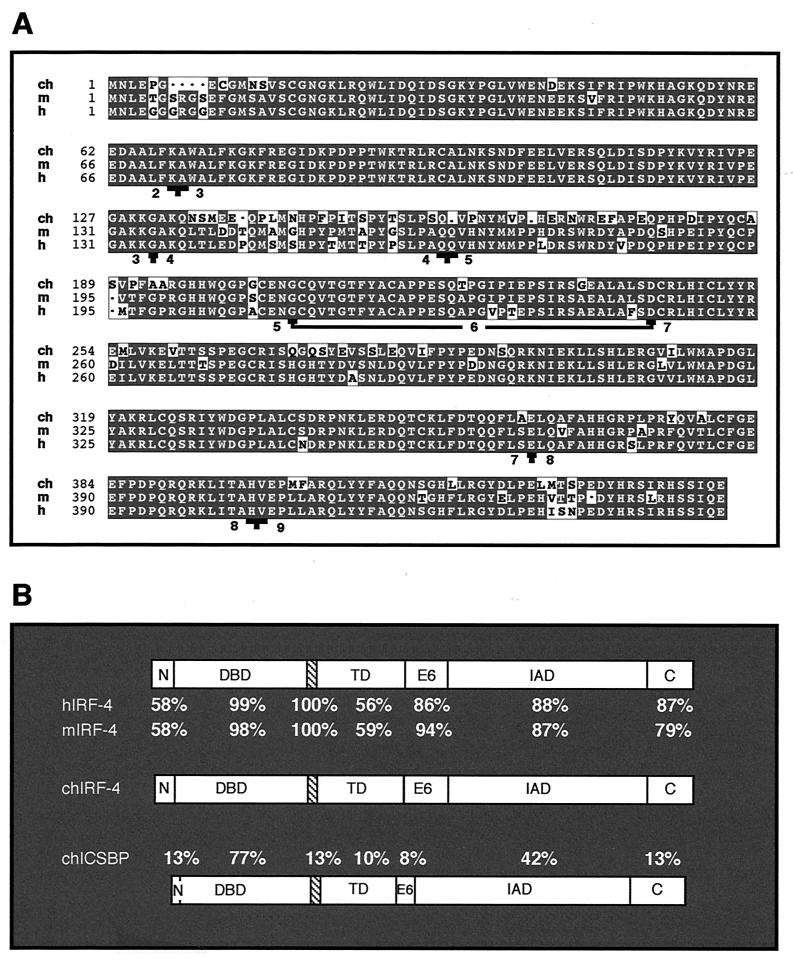
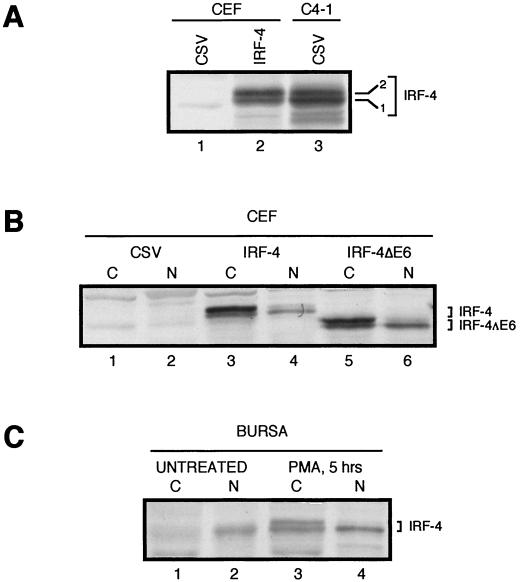
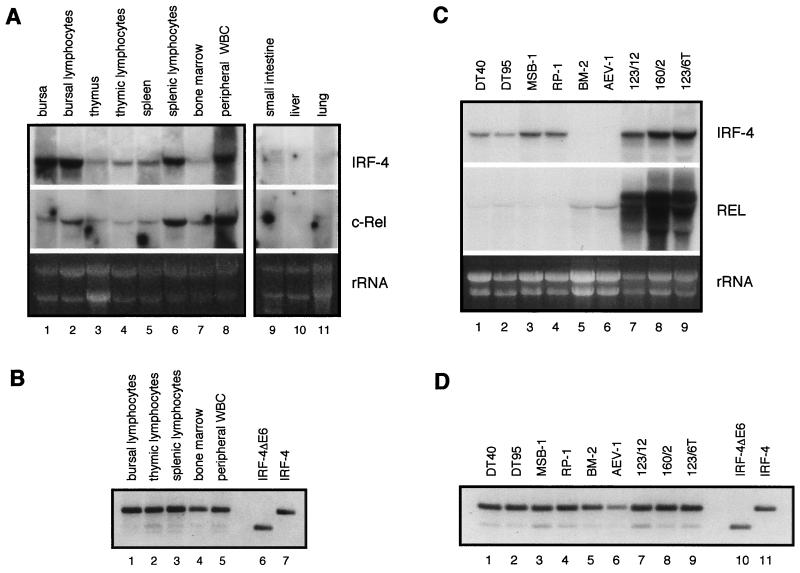
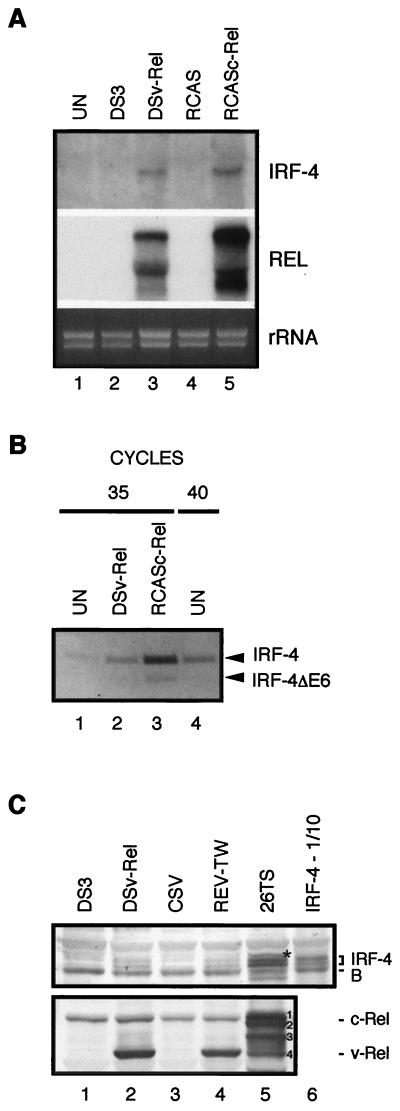
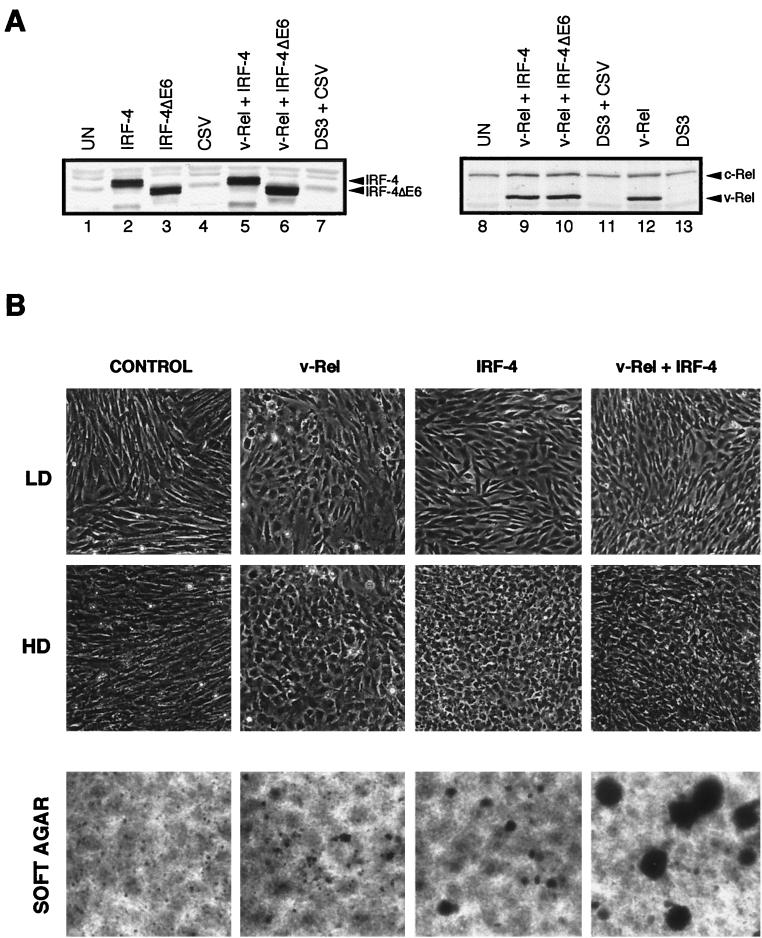
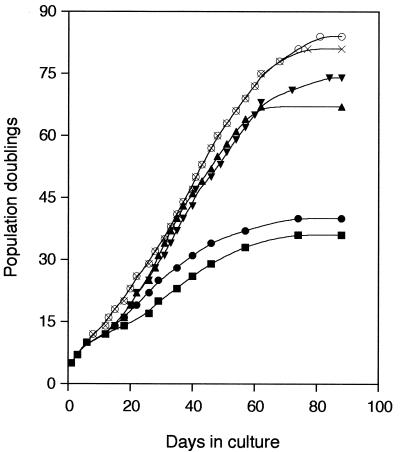
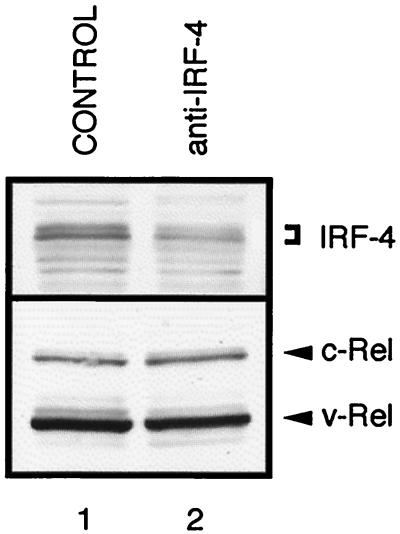
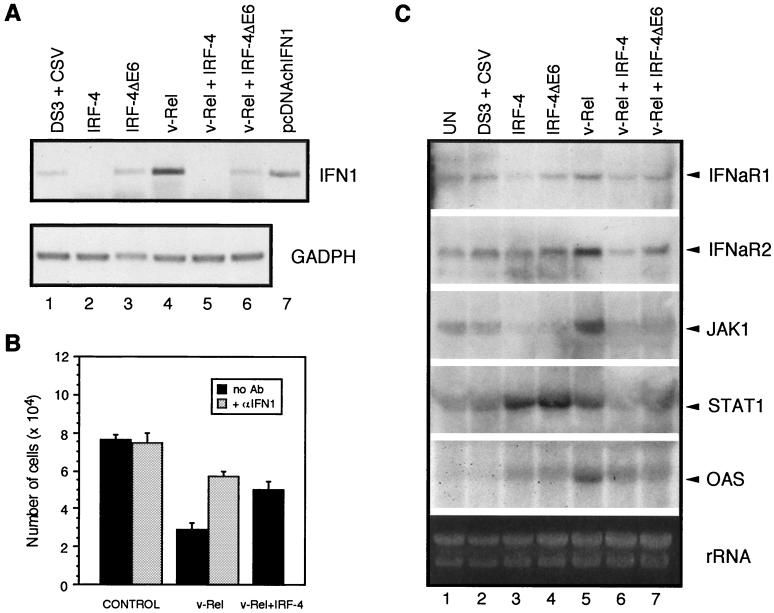
The avian homologue of the interferon regulatory factor 4 (IRF-4) and a novel splice variant lacking exon 6, IRF-4DeltaE6, were isolated and characterized. Chicken IRF-4 is expressed in lymphoid organs, less in small intestine, and lungs. IRF-4DeltaE6 mRNA, though less abundant than full-length IRF-4, was detected in lymphoid tissues, with the highest levels observed in thymic cells. IRF-4 is highly expressed in v-Rel-transformed lymphocytes, and the expression of IRF-4 is increased in v-Rel- and c-Rel-transformed fibroblasts relative to control cells. The expression of IRF-4 from retrovirus vectors morphologically transformed primary fibroblasts, increased their saturation density, proliferation, and life span, and promoted their growth in soft agar. IRF-4 and v-Rel cooperated synergistically to transform fibroblasts. The expression of IRF-4 antisense RNA eliminated formation of soft agar colonies by v-Rel and reduced the proliferation of v-Rel-transformed cells. v-Rel-transformed fibroblasts produced interferon 1 (IFN1), which inhibits fibroblast proliferation. Infection of fibroblasts with retroviruses expressing v-Rel resulted in an increase in the mRNA levels of IFN1, the IFN receptor, STAT1, JAK1, and 2',5'-oligo(A) synthetase. The exogenous expression of IRF-4 in v-Rel-transformed fibroblasts decreased the production of IFN1 and suppressed the expression of several genes in the IFN transduction pathway. These results suggest that induction of IRF-4 expression by v-Rel likely facilitates transformation of fibroblasts by decreasing the induction of this antiproliferative pathway.


Figures

FIG. 1
FIG. 1
Sequence and selected features of chicken IRF-4 cDNA. (A) Nucleotide and predicted amino acid sequence. The position of exon 6, which is absent in the splice variant of IRF-4, is indicated by a single bold underline. The open box in the 3′ UTR identifies a 46-bp element that is conserved between the chicken, human, and mouse IRF-4 cDNAs. The polyadenylation signal is denoted by a double underline. The last C nucleotide at position 3178 was followed by tracts of multiple A nucleotides in two independently isolated clones (pIRF4CT and pat.pk0027.c10 clones). (B) Putative translation start sites in chicken (ch), human (h), and mouse (m) IRF-4 cDNA sequences. Asterisks mark positions that are identical in all three sequences. The boxes around each of the two possible ATG start codons circumscribe a 10-bp element homologous to the Kozak consensus sequence (57). Identical nucleotides are found in both potential start sites at the most critical positions: G at position −3 and A at position +1 relative to the ATG codon. The positions of the first nucleotide shown are indicated on the left side with respect to the full-length cDNA sequences. (C) The 46-bp conserved element in the 3′ UTR of chicken (ch), human (h), and mouse (m) IRF-4 cDNAs. This conserved motif is preceded by a stretch of 82 nt that also shows significant, albeit limited, similarity to the corresponding regions of the mammalian cDNAs (data not shown). For asterisks and position numbers, see legend to panel B.
FIG. 2
FIG. 2
Comparison of predicted amino acid sequence of chicken IRF-4 with mouse and human IRF-4 and with chicken IRF-8 (chICSBP). (A) Sequence alignment of the chicken (ch), mouse (m), and human (h) IRF-4 protein sequences. Boundaries of individual exons of chicken IRF-4 were predicted based on the known exon-intron structure of the mouse and human IRF-4 genes. This prediction is supported by the highly conserved exon-intron structure of avian and mammalian IRF-8 genes (21, 52). Exons are numbered from 2 to 9, and the exon boundaries are indicated by a T sign. The underlined sequence encoded by exon 6 indicates the amino acids absent in IRF-4ΔE6. The codons for glycine 207 and aspartic acid 243 are spliced together in IRF4ΔE6 mRNA, forming a codon for aspartic acid. (B) Identical amino acids within predicted functional domains: N terminus (N), DBD, putative NLS (hatched box), transactivation domain (TD), exon 6 (E6), IAD, and the C terminus (C). These functional domains are located in chicken IRF-4 at the following amino acid positions: N terminus (1 to 15), DBD (16 to 126), putative NLS (127 to 134), transactivation domain (135 to 206), exon 6 (207 to 242), IAD (241 to 407), and C terminus (408 to 445). The region between amino acids 198 and 234 of chicken IRF-4 was determined by the program PEST-FIND to be a poor PEST sequence, with an assigned score of −3.95 (score ranges from −50 to +50, and only sequences with a score above +5 are considered likely to act as a PEST domain). Similar scores were obtained for homologous regions of human and mouse IRF-4.
FIG. 3
FIG. 3
Comparison of chicken IRF-4 and IRF-4ΔE6 proteins expressed from retroviral vectors in CEFs with endogenously expressed IRF-4 in chicken B cells. Western blot analysis was performed using IRF-4 antiserum AI4-6. (A) Two isoforms of IRF-4. Lysate from control CSV-infected CEFs is shown in lane 1. Two isoforms of IRF-4 detected in whole-cell lysates of CEF infected with retroviruses expressing IRF-4 (lane 2) comigrate with two isoforms of IRF-4 from whole-cell lysates of the S2A3 v-rel-transformed splenic B-cell line C4-1 infected with CSV (lane 3). Whole-cell extracts from 4 × 10⁵ cells were loaded in each lane. (B) Differential subcellular localization of the IRF-4 isoforms in CEF cultures. Cytoplasmic (C) and nuclear (N) lysates from 2 × 10⁵ CEFs infected with CSV (lanes 1 and 2) or exogenously expressing IRF-4 or IRF-4ΔE6 from retroviral vectors (lanes 3 to 6) were loaded in each lane. (C) Differential subcellular localization of the IRF-4 isoforms in bursal cells. Cytoplasmic (C) and nuclear (N) lysates from normal untreated bursal cells (lanes 1 and 2) and bursal cells treated with PMA for 5 h (lanes 3 and 4). Extracts from 2.5 × 10⁶ bursal lymphocytes were loaded in each lane.
FIG. 4
FIG. 4
Expression patterns of chicken IRF-4, IRF-4ΔE6, and c-rel mRNA. Expression was analyzed by Northern blot analysis (panels A and C) and by RT-PCR (panels B and D). Total RNA (10 μg) was subjected to Northern blot analysis. The probes used to detect c-rel or v-rel and IRF-4 mRNA are described in Table 1. RT-PCR was performed on RNA samples used in Northern blot analysis. Forty PCR cycles were completed. (A) Expression of IRF-4 and c-rel mRNA in various tissues from a 1-month-old chicken. Peripheral white blood cells (WBC) and lymphocyte-enriched fractions from bursa, thymus, and spleen were obtained by Histopaque purification as described in Materials and Methods. The intensity of the rRNA stained with ethidium bromide is shown in the bottom panel (rRNA). (B) Expression of IRF-4 and IRF-4ΔE6 in bursal, splenic, and thymic lymphocytes, peripheral white blood cells, and bone marrow cells determined by RT-PCR. pREV-IRF-4ΔE6 and pREV-IRF-4 plasmids were PCR amplified with the same primers used for RT-PCR (lanes 6 and 7). (C) Expression of IRF-4 (upper panel), c-rel mRNA, and retrovirally expressed v-rel RNA (middle panel) in transformed cell lines as determined by Northern blotting. RNAs from B-cell lines DT40 and DT95, T-cell lines MSB-1 and RP-1, myeloblastoid cell line BM-2, erythroblastoid cell line AEV-1, v-rel-transformed B-cell line 123/12, T-cell line 160/2, and macrophage-like cell line 123/6T were analyzed. The intensity of the rRNA stained with ethidium bromide is shown in the bottom panel (rRNA). (D) Expression of IRF-4 and IRF-4ΔE6 in DT95, DT40, MSB-1, RP-1, BM-2, AEV-1, 123/12, 160/2, and 123/6T cell lines determined by RT-PCR. pREV-IRF-4ΔE6 and pREV-IRF-4 plasmids were PCR amplified with the same primers as used for RT-PCR (lanes 10 and 11).
FIG. 5
FIG. 5
v-Rel and c-Rel induce the expression of IRF-4 in transformed fibroblasts. (A) Expression of IRF-4 mRNA in uninfected fibroblasts (UN) and fibroblasts either infected with empty retroviral vector (DS3), transformed by DSv-Rel, infected with empty retroviral vector RCAS, or transformed by RCASc-Rel. Total RNA (10 μg) was subjected to Northern blot analysis with the probes described in Table 1. The viral genomic and spliced RNAs in DSv-Rel- or RCASc-Rel-infected cells shown in the panel labeled Rel were detected with a c-rel probe. The endogenous c-rel mRNA was below the threshold of detection at this exposure. The membrane hybridized with a c-rel probe was exposed to film for 2 h, while the IRF-4 membrane was exposed for 48 h. The intensity of the rRNA stained with ethidium bromide is shown in the bottom panel (rRNA). (B) Expression levels of IRF-4 and IRF-4ΔE6 mRNA in uninfected fibroblasts (UN) and fibroblasts transformed by DSv-Rel or transformed by RCASc-Rel were determined by RT-PCR. Lanes 1 to 3 show the products from these cell types after 35 cycles, while lane 4 shows the product from uninfected fibroblasts after 40 cycles. The PCR products corresponding to IRF-4 and IRF-4ΔE6 are indicated on the right side of the panel. (C) Western blot analysis of IRF-4 and Rel expression in fibroblasts. Whole-cell extracts from fibroblasts either infected with empty retroviral vector DS3, transformed by DSv-Rel, infected with CSV helper virus, or transformed by REV-TW and from sarcoma-derived fibroblastoid cell line 26T6 were analyzed. Lane 6 contains a mixture of lysate from CEFs overexpressing IRF4 from a retroviral vector and lysate from CSV-infected control CEFs (1:9). Extracts from 3 × 10⁵ to 4 × 10⁵ CEFs and 26TS cells were loaded per lane, blotted, and stained with anti-IRF-4 AI4-6 serum (upper panel) or anti-Rel HY87 antibody (lower panel). Positions of the two IRF-4 bands, a prominent background band (B), v-Rel, and c-Rel are indicated on the right side. The bands marked with the asterisk and numbers 1 to 4 in lane 5 are discussed in the text.
FIG. 6
FIG. 6
Transformation of chicken fibroblasts by v-Rel and IRF-4. CEFs were infected by retroviruses expressing v-Rel, IRF-4, or IRF-4ΔE6 or coinfected by v-Rel-expressing viruses with either IRF-4- or IRF-4ΔE6-expressing viruses at a multiplicity of infection of 3. Control cells were left uninfected or infected with CSV and DS3 empty-vector retroviruses. The morphology of these cells, their ability to form soft agar colonies, and the level of v-Rel and retrovirally expressed IRF-4 or IRF-4ΔE6 expressed in them were analyzed between 2 and 3 weeks after infection. (A) Equal protein levels of exogenously expressed IRF-4, IRF-4ΔE6, and v-Rel in singly and doubly infected cultures. Whole-cell extracts from 2 × 10⁵ cells from the cultures shown below were blotted and stained with anti-IRF-4 AI4-6 serum (left panel) or anti-Rel HY87 antibody (right panel). Positions of IRF-4 and Rel proteins are indicated on the right side of each panel. (B) Phase-contrast microphotography of low-density (LD) and high-density (HD) cultures. Original photographs were taken at 100× magnification; the printed images are decreased to 70% of the original. Since all three control groups had identical morphology, only the results for CSV-infected control cells are shown. The morphology of cells transformed by IRF-4ΔE6-infected or v-Rel- and IRF-4ΔE6-infected fibroblasts was less pronounced but otherwise similar to IRF-4- or v-Rel- and IRF-4-transformed cells, respectively. The growth of cells transformed by v-Rel, IRF-4, or v-Rel and IRF-4 in soft agar is shown in the bottom row of panels. Since none of the three control groups form colonies in soft agar, only the results for CSV-infected control cells are shown. CEF cultures infected with these viruses were plated in soft agar 4 weeks after infection, and the growth of colonies was scored 3 weeks after plating. Original photographs were taken at 40× magnification; the printed images are decreased to 56% of the original size.
FIG. 7
FIG. 7
Growth curves of cells expressing IRF-4, IRF-4ΔE6, v-Rel, and IRF-4 or IRF-4ΔE6, with v-Rel showing the cumulative increase in cell generations with time in culture. CEFs were infected with retroviruses expressing v-Rel (▪), IRF-4 (▴), or IRF-4ΔE6 (▾) or coinfected with retroviruses expressing v-Rel and IRF-4 (○) or v-Rel and IRF-4ΔE6 (×) at a multiplicity of infection of 3. Control cells were infected with empty vector retroviruses (•) or left uninfected. Uninfected fibroblasts had the same number of generations as fibroblasts infected by empty vector (data not shown). Each culture was split 1:8 when it reached confluence. This experiment was repeated twice with similar results.
FIG. 8
FIG. 8
Expression of an antisense IRF-4 construct reduces IRF-4 expression in v-Rel-transformed cells. The S2A3 v-rel lymphoid cell line C4-1 was infected with REV–anti-IRF-4 (anti-IRF-4) or with CSV helper (control). Whole-cell extracts were prepared 48 h after infection and analyzed by Western blot using AI4-6 (anti-IRF-4) serum and HY87 (anti-Rel) antibody. The extracts from 105 cells were loaded in each lane. Positions of IRF-4 and Rel proteins are indicated on the right side of each panel.
FIG. 9
FIG. 9
Modulation of the expression of genes of the IFN transduction pathway by IRF-4 and IRF-4ΔE6 in v-Rel-transformed fibroblasts. (A) The expression of IFN1 and the control gene GAPDH as determined by RT-PCR. Total RNA was prepared from the cultures described in the legend to Fig. 6. Products of PCR amplification from pcDNAchIFN1 (Table 1) using the same primers as in RT-PCR are shown (lane 7). Because IFN1 is an intronless gene, RNAs for cDNA synthesis were first treated with DNase I as described in Materials and Methods. PCR with pretreated RNA as a substrate confirmed that no detectable IFN1 DNA was present in the RNA samples (data not shown). (B) CEF cultures were infected with empty vector viruses DS3 and CSV for 1 week to induce resistance of CEF to subsequent viral infection. Cells were seeded to 24-well plates (104 cells per well), and medium was replaced with 0.5 ml of culture supernatant from v-Rel- or v-Rel- and IRF-4-transformed fibroblasts after 1 day. The supernatant fluids from DS3 virus-expressing CEFs were used as a control. The supernatant fluids from v-Rel-transformed and control cells were also incubated with monoclonal antibody 8A9 against IFN1 (purified immunoglobulin diluted 1:1,400) for 2 h on ice before application to CEF cultures. The number of cells in each culture was determined 2 days after exposure to the culture medium. The mean and standard errors (error bars) for three to six independent experiments are shown. (C) Expression of IFNaR1, IFNaR2, JAK1, STAT1, and OAS genes was determined by Northern blot analysis. RNA was prepared from the cultures shown in Fig. 6.

Similar articles

Cited by

References

    1. Abbadie C, Kabrun N, Bouali F, Smardova J, Stehelin D, Vandenbunder B, Enrietto P J. High levels of c-relexpression are associated with programmed cell death in the developing avian embryo and in bone marrow cells in vitro. Cell. 1993;75:899–912. - PubMed
    1. Abdrakhmanov I, Lodygin D, Geroth P, Arakawa H, Law A, Plachy J, Korn B, Buerstedde J M. A large database of chicken bursal ESTs as a resource for the analysis of vertebrate function. Genome Res. 2000;10:2062–2069. - PMC - PubMed
    1. Akiyama Y, Kato S. Two cell lines from lymphomas of Marek's disease. Biken J. 1974;17:105–116. - PubMed
    1. Altschul S F, Gish W, Miller W, Myers E W, Lipman D J. Basic local alignment search tool. J Mol Biol. 1990;215:403–410. - PubMed
    1. Altschul S F, Madden T L, Schaffer A A, Zhang J, Zhang Z, Miller W, Lipman D J. Gapped BLAST and PSI-BLAST: a new generation of protein database search programs. Nucleic Acids Res. 1997;25:3389–3402. - PMC - PubMed

Publication types

MeSH terms

Associated data