. 2001 Oct;21(19):6585-97.
doi: 10.1128/MCB.21.19.6585-6597.2001.

Polycomb group repression reduces DNA accessibility

Affiliations

Polycomb group repression reduces DNA accessibility

D P Fitzgerald et al. Mol Cell Biol. 2001 Oct.

Abstract

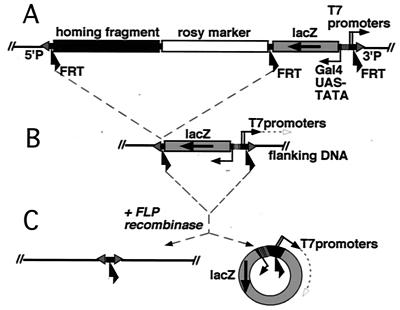
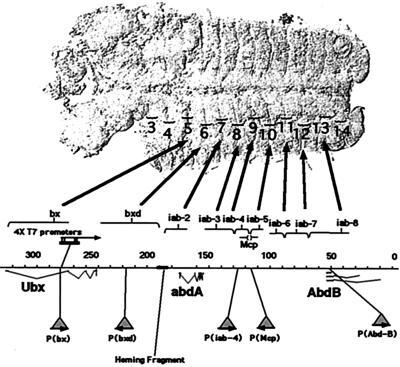
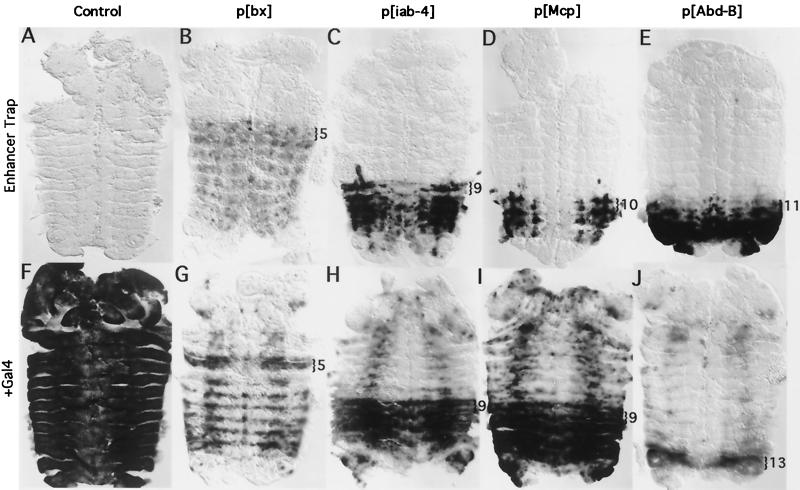
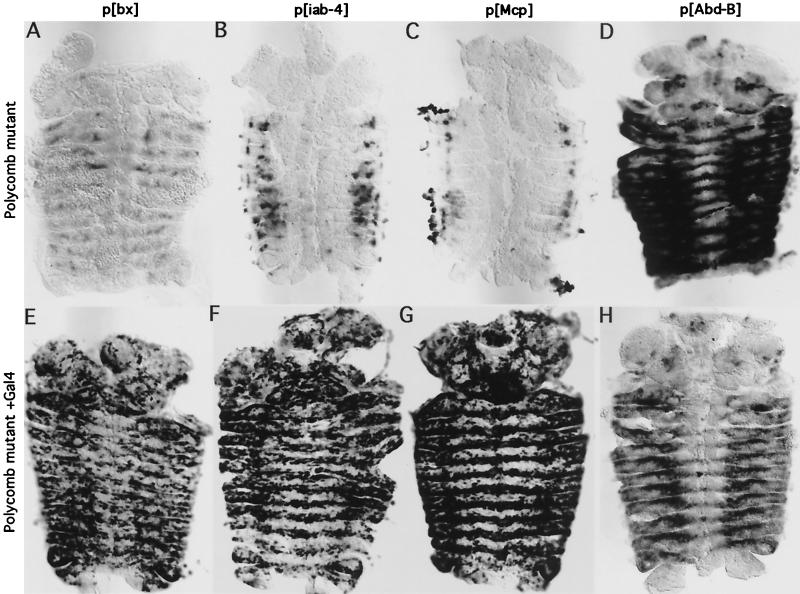
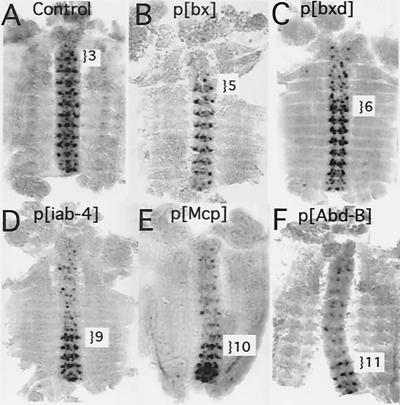
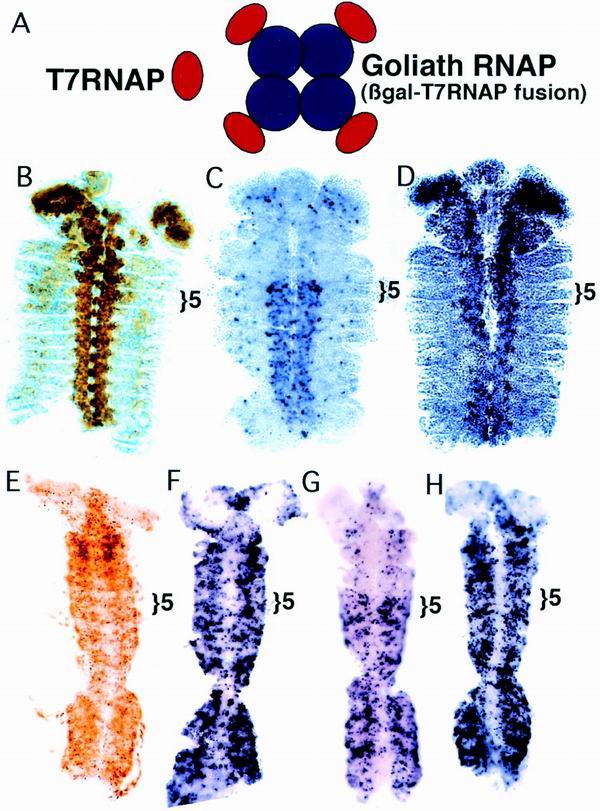
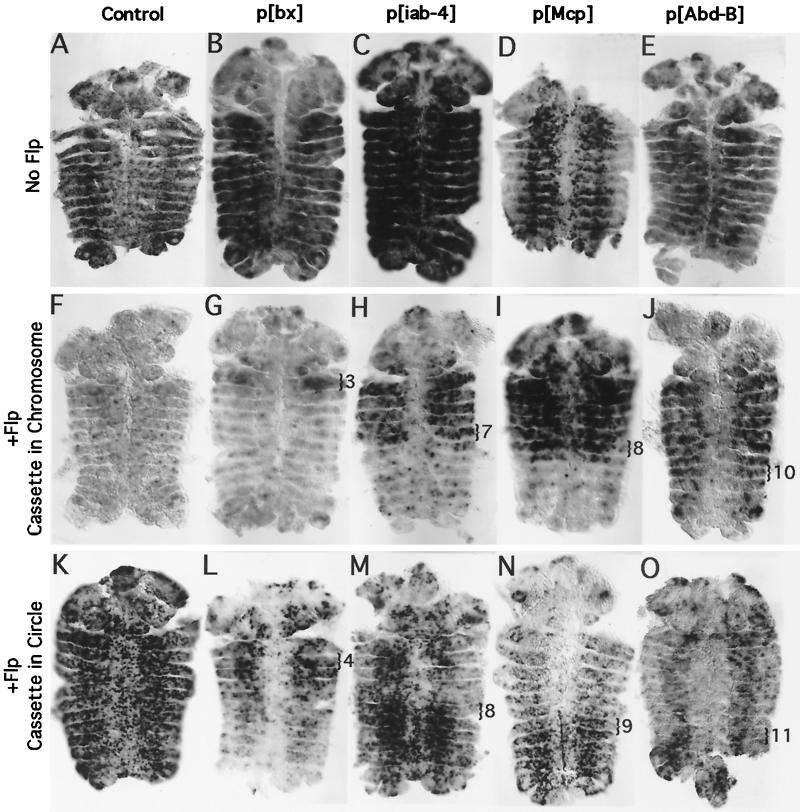
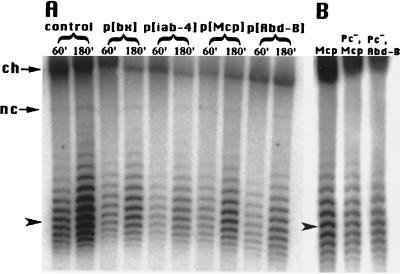
The Polycomb group proteins are responsible for long-term repression of a number of genes in Drosophila melanogaster, including the homeotic genes of the bithorax complex. The Polycomb protein is thought to alter the chromatin structure of its target genes, but there has been little direct evidence for this model. In this study, the chromatin structure of the bithorax complex was probed with three separate assays for DNA accessibility: (i) activation of polymerase II (Pol II) transcription by Gal4, (ii) transcription by the bacteriophage T7 RNA polymerase (T7RNAP), and (iii) FLP-mediated site-specific recombination. All three processes are restricted or blocked in Polycomb-repressed segments. In contrast, control test sites outside of the bithorax complex permitted Gal4, T7RNAP, and FLP activities throughout the embryo. Several P insertions in the bithorax complex were tested, providing evidence that the Polycomb-induced effect is widespread over target genes. This accessibility effect is similar to that seen for SIR silencing in Saccharomyces cerevisiae. In contrast to SIR silencing, however, episomes excised from Polycomb-repressed chromosomal sites do not show an altered superhelix density.


Figures

FIG. 1
FIG. 1
The P element construct serves as a target for Gal4, T7RNAP, and FLP. (A) Diagram of the P element. The initial P insertions contain two cassettes, each flanked by directly oriented FRT sequences. The left cassette contains the rosy transformation marker, and a “homing fragment,” which targets P elements to the BX-C chromosome region. The right cassette contains two tandem T7 promoters and a Gal4 activatable UAS-LacZ reporter. (B) Trimmed-down insertions, which lack the homing/rosy + cassette, were recovered as rosy LacZ+ individuals following FLP induction in the germ line. The T7 promoters are poised to transcribe the genomic DNA flanking the 3′ P end. (C) Expression of FLP recombinase in a whole embryo results in excision of the T7 promoter/UAS-LacZ cassette from the chromosome, resulting in formation of a 4.9-kb circular episome in somatic cells. The T7 promoters are then poised to produce antisense copies of LacZ RNA.
FIG. 2
FIG. 2
Five P element insertions were recovered within the BX-C. Transcription units are marked for the three homeotic genes, Ubx, abd-A, and Abd-B. Coordinates from the published sequence are shown (in kilobases). Above the map, control regions for each of the genes are denoted by brackets, and the large arrows point to the most anterior parasegments that they regulate in the fly embryo (displayed with the anterior portion to the left). The sites of insertion of the five P elements are indicated below the map as triangles. The location of the original 4× T7 promoters in the bx region (29) is indicated above the map as a black rectangle. Arrows denote the orientation of the T7 promoters.
FIG. 3
FIG. 3
Gal4 is partially blocked by the PcG. (A to E) Enhancer trap patterns in the P insertion lines. RNA in situ hybridizations showing LacZ expression (in the absence of Gal4) in germ band retracted embryos. (A) A control embryo containing the UAS-LacZ cassette on the 3rd chromosome outside of the BX-C shows no LacZ expression. (B to E) Trimmed-down insertions p[bx], p[iab-4], p[Mcp], and p[Abd-B], respectively. The most anterior parasegment in which transcription occurs is marked with a bracket. (F to J) Gal4 activation of LacZ expression. (F) Gal4 strongly activates LacZ expression throughout the control embryo. (G to J) Gal4 activation in p[bx], p[iab-4], p[Mcp], and p[Abd-B], respectively. LacZ expression is much weaker or absent in PcG-repressed segments. The anterior-most parasegment in which strong activation of LacZ transcription occurs is marked with a bracket. All embryos shown in this and subsequent figures are dissected along the dorsal midline and are displayed as “pelts,” with the anterior oriented toward the top of the page.
FIG. 4
FIG. 4
Polycomb mutant embryos show a weak spread of LacZ expression, but allow Gal4 to activate LacZ transcription throughout the embryo. All panels show in situ hybridizations to LacZ RNA in germ band retracted embryos. (A to D) Enhancer trap patterns in Polycomb zygotic null embryos containing the p[bx], p[iab-4], p[Mcp], and p[Abd-B] insertions, respectively. (E to H) Gal4 activation of LacZ transcription in Polycomb zygotic null embryos.
FIG. 5
FIG. 5
Transcription by T7RNAP is partially blocked by the PcG at multiple sites within the BX-C. RNA in situ hybridizations in germ band retracted embryos. All embryos contained a source of T7RNAP, which is expressed in the CNS. (A) The control is an embryo containing a P element with the T7 promoter/UAS-LacZ cassette inserted on the X chromosome. T7RNAP produces a transcript in the cells of the CNS from PS3 to -14, mirroring the expression pattern of the polymerase. (B to F) Transcription by T7RNAP in the BX-C insertions. In panels C and D, the initial full-length P elements were used, and in panels B, E, and F, the trimmed-down forms were used. The anterior-most parasegment in which the control region is active is indicated for each embryo. In the anterior segments repressed by the PcG, T7RNAP produces a transcript in only a subset of the polymerase-producing cells.
FIG. 6
FIG. 6
An enlarged polymerase is more sensitive to PcG repression. (A) Drawing comparing wild-type T7RNAP and Goliath polymerase. (B) Pattern of Goliath polymerase protein in the CNS Goliath line in a germ band retracted embryo. The location of Goliath polymerase was detected with a monoclonal antibody to β-galactosidase. PS5, the anterior limit of bx enhancer activity, is indicated with a bracket. (C) Transcription by Goliath polymerase on the 4× T7 promoters in the bx control region in a germ band retracted embryo. Transcription by Goliath is blocked anterior to PS5. (D) Transcription by Goliath polymerase in an extra sex combs mutant embryo (esc2/esc10, maternal and zygotic null). The repression in anterior segments is lost. (E to H) T7RNAP versus Goliath polymerase as shown by expression of the polymerases with the Gal4-UAS system. A ubiquitous Gal4 source (line 32B) was used to drive polymerase expression. All embryos are in the germ band extended stage. (E) Goliath polymerase protein pattern marked with an antibody to β-galactosidase. (F) Transcription by T7RNAP on the 4× T7 promoters in the bx control region. Transcription appears unaffected by the PcG. (G) Transcription by Goliath polymerase. Transcription is repressed by the PcG anterior to PS5. (H) Transcription by Goliath polymerase in a Polycomb mutant (zygotic null). Repression in the anterior segments is lost.
FIG. 7
FIG. 7
FLP recombinase is partially blocked by the PcG. RNA in situ hybridizations were used to distinguish T7 promoters in the chromosome or in FLP-induced circles in germ band retracted embryos. (A to E) Control embryos lacking FLP. RNA probes detect transcription of flanking genomic sequences from the T7 promoters in the P insertions. In the absence of FLP, all T7 promoter cassettes remain in the chromosome and are poised to transcribe the flanking genomic DNA. Under these assay conditions, no segmental bias in transcription by T7RNAP is apparent in any of the fly lines. (F to J) Transcription of chromosome sequences by T7RNAP marks cells in which FLP has failed to access its FRT target sites, which flank the T7 promoter/UAS-LacZ cassette. (F) FLP efficiently excises the cassette from the majority of the cells in a control line, in which the cassette is located on the X chromosome. (G to J) In the BX-C insertion lines, FLP fails to excise the cassette in many cells in PcG-repressed segments. The block to circle formation appears to occur one parasegment anterior to the block to Pol II transcription. The posterior-most parasegment in which chromosomal transcription is strong is marked with a bracket. (K to O) Transcription of antisense LacZ RNA by T7RNAP marks cells in which FLP has succeeded in producing a circular episome. (K) Circles are visible in most cells in the control embryo. (L to O) A greater number of circles are visible in non-PcG-repressed segments in the BX-C insertion lines. The anterior-most parasegment in which robust circle formation is visible is marked with a bracket.
FIG. 8
FIG. 8
PcG repression is not associated with altered DNA supercoiling. Circular episomes produced from the FLP cassettes were subject to electrophoresis through agarose gels supplemented with 2 μg of chloroquine per ml. Under these conditions, more negatively supercoiled DNA has a faster mobility. The gels were Southern blotted and probed with lacZ sequence. (A) Total genomic DNA was prepared from adult fly heads, either immediately following a 1-h heat shock treatment to induce FLP activity (60′) or following 1 h of heat shock plus 2 h of recovery at room temperature (180′). All of the circles produced in the p[bx], p[iab-4], p[Mcp], and p[Abd-B] lines come from PcG-repressed DNA. The control is the 3rd chromosome insertion, which is not PcG repressed. The average linking number is approximately the same for all lanes. The locations of the unexcised DNA remaining in the chromosome (ch) and of nicked circles (nc) are marked with arrows. The average linking number for the sample in the first lane is indicated with an arrowhead (see Materials and Methods). (B) Total genomic DNA was prepared from whole embryos following 1 h of heat shock plus a half-hour of recovery at room temperature to induce FLP activity. This DNA was subjected to chloroquine gel and Southern blot analyses as described above. Circles produced from the p[Mcp] line with wild-type PcG activity are compared to circles produced from p[Mcp] and p[Abd-B] lines, which are null for the Polycomb protein. The loss of PcG repression does not alter the topology of the DNA in these regions.

Similar articles

Cited by

References

    1. Ahmad K, Golic K G. Somatic reversion of chromosomal position effects in Drosophila melanogaster. Genetics. 1996;144:657–670. - PMC - PubMed
    1. Ansari A, Cheng T-H, Gartenberg M R. Isolation of selected chromatin fragments from yeast by site-specific recombination in vivo. Methods Companion Methods Enzymol. 1999;17:104–111. - PubMed
    1. Bender W, Hudson A. P element homing to the Drosophila bithorax complex. Development. 2000;127:3981–3992. - PubMed
    1. Bi X, Broach J R. DNA in transcriptionally silent chromatin assumes a distinct topology that is sensitive to cell cycle progression. Mol Cell Biol. 1997;17:7077–7087. - PMC - PubMed
    1. Bienz M, Müller J. Transcriptional silencing of homeotic genes in Drosophila. BioEssays. 1995;17:775–783. - PubMed

Publication types

MeSH terms

Substances

LinkOut - more resources