. 2001 Sep 11;98(19):10630-5.
doi: 10.1073/pnas.191313598. Epub 2001 Sep 4.

Genomic profiling of short- and long-term caloric restriction effects in the liver of aging mice

Affiliations

Genomic profiling of short- and long-term caloric restriction effects in the liver of aging mice

S X Cao et al. Proc Natl Acad Sci U S A. .

Abstract

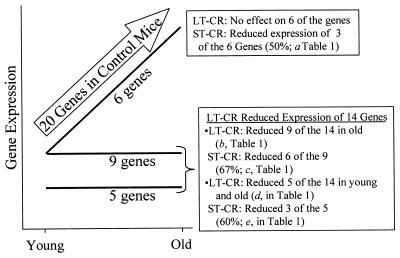
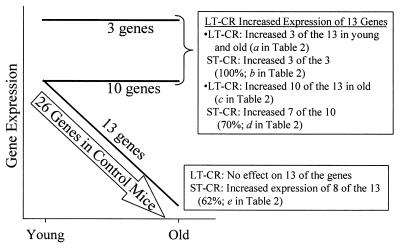
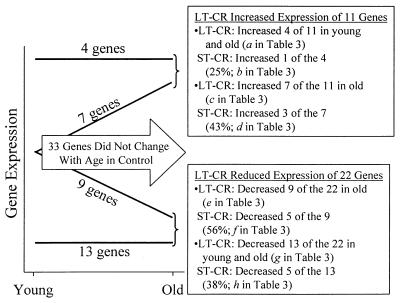
We present genome-wide microarray expression analysis of 11,000 genes in an aging potentially mitotic tissue, the liver. This organ has a major impact on health and homeostasis during aging. The effects of life- and health-span-extending caloric restriction (CR) on gene expression among young and old mice and between long-term CR (LT-CR) and short-term CR (ST-CR) were examined. This experimental design allowed us to accurately distinguish the effects of aging from those of CR on gene expression. Aging was accompanied by changes in gene expression associated with increased inflammation, cellular stress, and fibrosis, and reduced capacity for apoptosis, xenobiotic metabolism, normal cell-cycling, and DNA replication. LT-CR and just 4 weeks of ST-CR reversed the majority of these changes. LT-CR produced in young mice a pattern of gene expression that is a subset of the changes found in old LT-CR mice. It is possible that the early changes in gene expression, which extend into old age, are key to the life- and health-span-extending effects of CR. Further, ST-CR substantially shifted the "normo-aging" genomic profile of old control mice toward the "slow-aging" profile associated with LT-CR. Therefore, many of the genomic effects of CR are established rapidly. Thus, expression profiling should prove useful in quickly identifying CR- mimetic drugs and treatments.


Figures

Figure 1
Figure 1
LT- and ST-CR effects on the expression profile of 20 liver genes whose expression increases with age (arrow). LT-CR opposed the age-associated increase in the expression of 14 genes, in the manner shown by the lines labeled “9 genes” and “5 genes.” For the 9 genes, LT-CR returned expression to youthful levels in old mice. For the 5 genes, LT-CR reduced expression in both young and old mice. LT-CR had no effect on the expression of 6 of the 20 genes (line labeled “6 genes”). These genes are identified by the notation “NE” in Table 1. The effects of ST-CR are described in the text boxes.
Figure 2
Figure 2
Effects of LT- and ST-CR on the expression profile of 26 liver genes whose expression decreases with age (arrow). LT-CR opposed the age-associated decrease in the expression of 13 genes, in the manner shown by the lines labeled “3 genes” and “10 genes.” For the 3 genes, LT-CR increased expression in both young and old mice. For the 10 genes, LT-CR increased expression to youthful levels in old mice. LT-CR had no effect on the expression of 13 of the 26 genes (line labeled “13 genes”). These genes are identified by the notation “NE” in Table 2. The effects of ST-CR are described in the text boxes.
Figure 3
Figure 3
Effects of LT- and ST-CR on the expression profile of 33 liver genes whose expression remains unchanged during aging of control mice (arrow). Expression of 11 of the 33 genes increased in the LT-CR group, in the manner shown by the lines labeled “4 genes” and “7 genes.” For the 4 genes, LT-CR increased expression in both young and old mice. For the 7 genes, LT-CR increased expression only in old mice. Expression of 22 of the 33 genes decreased in the LT-CR group, in the manner shown by the lines labeled “9 genes” and “13 genes.” For the 9 genes, LT-CR decreased expression only in old mice. For the 13 genes, LT-CR decreased expression in both young and old mice. The effects of ST-CR are described in the text boxes.

References

    1. Lee C K, Weindruch R, Prolla T A. Nat Genet. 2000;25:294–297. - PubMed
    1. Jiang C H, Tsien J Z, Schultz P G, Hu Y. Proc Natl Acad Sci USA. 2001;98:1930–1934. - PMC - PubMed
    1. Lee C K, Klopp R G, Weindruch R, Prolla T A. Science. 1999;285:1390–1393. - PubMed
    1. Schmucker D L. J Gerontol A Biol Sci Med Sci. 1998;53:B315–B320. - PubMed
    1. McCay C M, Crowell M F, Maynard L A. J Nutr. 1935;10:63–79. - PubMed