. 2001 Sep 11;98(19):10692-7.
doi: 10.1073/pnas.191360198. Epub 2001 Sep 4.

Regulation of melastatin, a TRP-related protein, through interaction with a cytoplasmic isoform

Affiliations

Regulation of melastatin, a TRP-related protein, through interaction with a cytoplasmic isoform

X Z Xu et al. Proc Natl Acad Sci U S A. .

Abstract

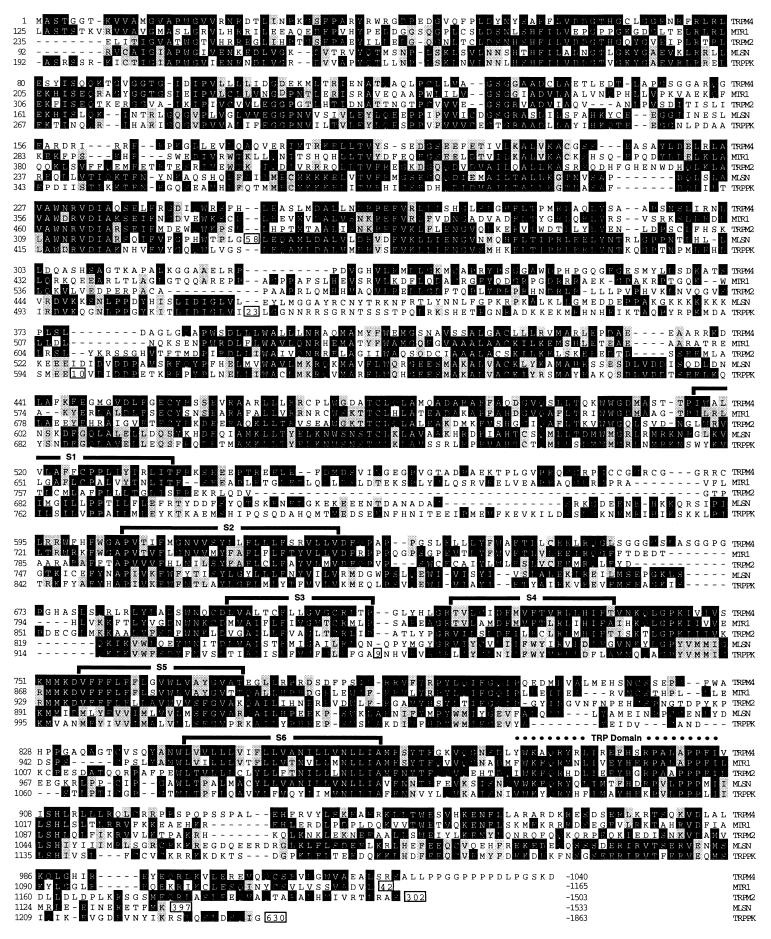
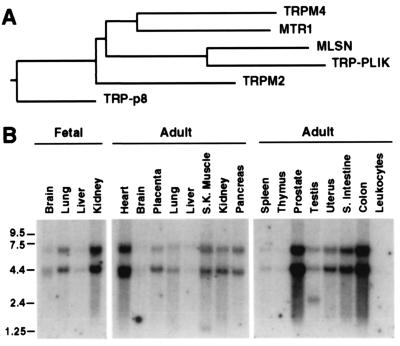
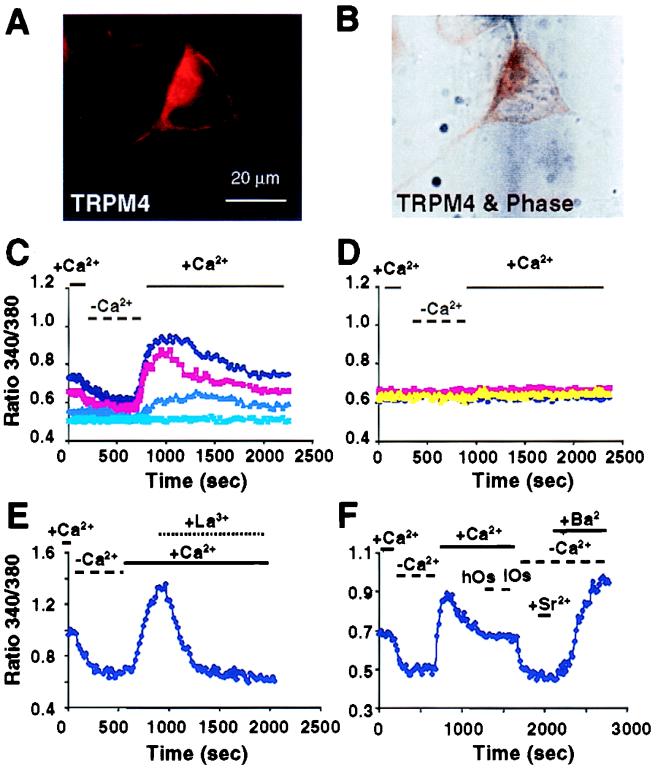
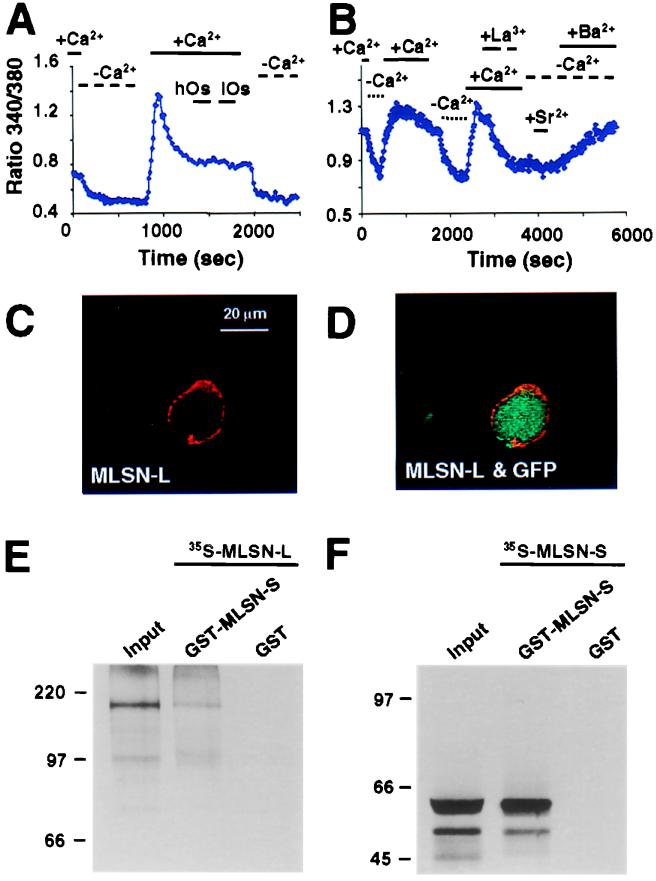
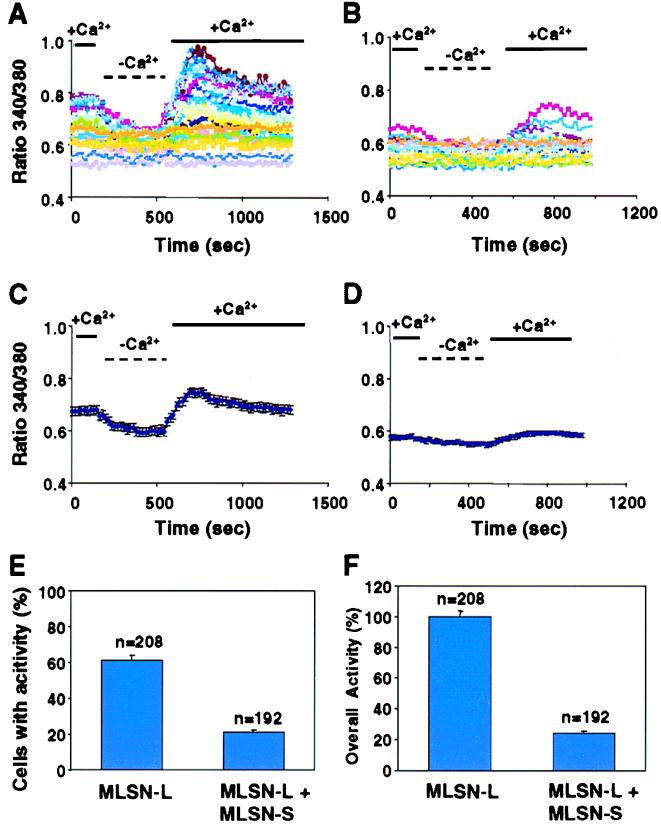
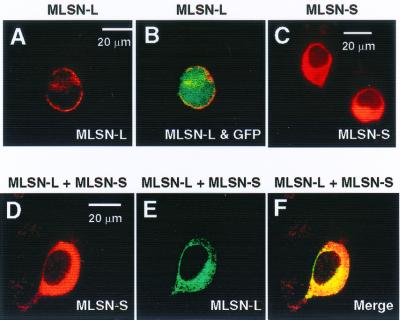
The TRP (transient receptor potential) superfamily includes a group of subfamilies of channel-like proteins mediating a multitude of physiological signaling processes. The TRP-melastatin (TRPM) subfamily includes the putative tumor suppressor melastatin (MLSN) and is a poorly characterized group of TRP-related proteins. Here, we describe the identification and characterization of an additional TRPM protein TRPM4. We reveal that TRPM4 and MLSN each mediate Ca(2+) entry when expressed in HEK293 cells. Furthermore, we demonstrate that a short form of MLSN (MLSN-S) interacts directly with and suppresses the activity of full-length MLSN (MLSN-L). This suppression seems to result from the inhibition of translocation of MLSN-L to the plasma membrane. We propose that control of translocation through interaction between MLSN-S and MLSN-L represents a mode for regulating ion channel activity.


Figures

Figure 1
Figure 1
Alignment of TRPM4 with other TRPM proteins. Shown are the sequences corresponding to TRPM4, MTR1, TRPM2 (formerly TRPC7), MLSN-L (MLSN), and TRP-PLIK (TRPPK). The alignment was generated with CLUSTALX. To maximize the alignment, several gaps, indicated by the dashes, were introduced. The sequences corresponding to several small regions in MLSN and TRP-PLIK are not shown. The numbers of residues not shown are indicated at the appropriate positions. The positions of the six putative transmembrane segments (S1–6) and the TRP domain are indicated. The sizes of the C-terminal sequences not shown in MTR1, TRPM2, MLSN, and TRP-PLIK are indicated. Amino acids that are identical in at least two sequences are indicated with a black box. If a second pair of amino acids is conserved at the same position, it is indicated by the shading in gray. The running tally of amino acids is indicated to the left.
Figure 2
Figure 2
TRPM4 is a member of the TRPM subfamily. (A) Phylogenetic tree. The tree was generated with the MEGALIGN software (DNAStar) after assembling the alignment with CLUSTALX. (B) Tissue distribution of TRPM4 RNA. Fetal and adult multiple-tissue RNA blots were probed with a labeled TRPM4 cDNA. RNA size markers (in kb) are shown.
Figure 3
Figure 3
Expression of TRPM4 promotes Ca2+ influx. (A) Confocal image of TRPM4 localization in HEK293 cells. The TRPM4 protein was detected with antibodies that recognize the N-terminal FLAG epitope tag. (B) The immunofluorescent image in A was superimposed on the phase-contrast image acquired from the same cell. (C) TRPM4-expressing cells exhibited an increase in Ca2+ influx. HEK293 cells were cotransfected with pTRPM4 and pYFP. After incubation with fura-2-AM, the YFP-positive cells were selected for Ca2+ imaging. The bottom trace was a YFP-negative cell. Ca2+-containing and Ca2+-free solutions were changed as indicated. (D) Control cells transfected with an empty pcDNA3 vector and pYFP. (E) The TRPM4-dependent Ca2+-influx activity was sensitive to 80 μM La3+. (F) Expression of TRPM4 led to an influx of Ba2+ but not Sr3+. Application of solutions with high and low osmolarity (hOs and lOs, respectively) had no effect on Ca2+ influx.
Figure 4
Figure 4
Activity, spatial localization, and protein interactions of MLSN-L. (A) Expression of MLSN-L increased Ca2+ influx in HEK293 cells. Cells were cotransfected with pMLSN-L and pYFP; Ca2+ influx was assessed by Ca2+ imaging. (B) MLSN-L was sensitive to La3+ (80 μM) inhibition and promoted the influx of Ba2+ but not Sr2+. (C) Confocal image of the MLSN-L protein. Cells were cotransfected with pMLSN-L (MYC tagged) and pGFP and stained with anti-MYC antibodies. (D) The spatial distribution of GFP (green) was superimposed on the confocal image of MLSN-L (same cell as in C). (E) MLSN-L interacted with MLSN-S in pull-down assays. A GST-MLSN-S fusion protein or GST alone was bound to glutathione beads and incubated with MLSN-L labeled in vitro with [35S]methionine. The beads were washed, and bound proteins were eluted with SDS sample buffer and fractionated by SDS/PAGE. The input lanes (E and F) contain 10% of the probes used in the experiments. (F) MLSN-S formed homomeric interactions. A 35S-labeled MLSN-S probe was incubated with GST-MSLN-S or GST alone immobilized on glutathione beads. The beads were washed and the eluted proteins were fractionated by SDS/PAGE. Protein size markers (in kDa) are shown.
Figure 5
Figure 5
MLSN-S suppressed the activity of MLSN-L. (A) Ca2+-influx activity in MLSN-L-expressing cells. A typical experiment in which 12 of 21 cells displayed Ca2+-entry activity is shown. (B) Suppression of MLSN-L activity by MLSN-S. Shown is a typical experiment in which a lower ratio (5 of 20) of cells coexpressing MLSN-L and MLSN-S displayed Ca2+-entry activity than cells expressing MLSN-L alone. The average 340/380 ratio was also lower in those cells that exhibited Ca2+ influx. (C) Average 340/380 ratios obtained from the traces shown in A. (D) Average 340/380 ratios obtained from the traces shown in B. (E) A lower percentage of cells cotransfected with MLSN-L and MLSN-S showed Ca2+-influx activity than cells transfected with MLSN-L alone. Those cells that displayed an increase in the 340/380 ratio of ≥0.05 after reapplication of Ca2+ were scored as displaying a positive response. (F) The overall level of MLSN-L-dependent Ca2+-influx activity was suppressed by MLSN-S. The Ca2+-influx activity was calculated as follows for each individual cell: the 340/380 ratio in the Ca2+-free solution was subtracted from the peak 340/380 ratio after Ca2+ reapplication. The average value obtained from those cells expressing MLSN-L alone was defined as 100%. In CF, error bars represent SEM.
Figure 6
Figure 6
MLSN-S altered the subcellular localization of MLSN-L. The spatial distributions of MLSN-L and MLSN-S were examined with confocal microscopy. (A) MLSN-L was primarily localized in or near the plasma membrane. HEK293 cells expressing MYC-tagged MLSN-L were stained with anti-MYC antibodies. (B) Relative spatial distributions of GFP and MLSN-L. Image of the anti-MYC staining (cell shown in A) is merged with the GFP localization. (C) MLSN-S was detected mainly in the cytosol. Cells expressing FLAG-tagged MLSN-S were stained with anti-FLAG antibodies. (DF) Cells cotransfected with pMLSN-L (MYC tagged) and pMLSN-S (FLAG tagged) were double stained with rabbit anti-MYC and mouse anti-FLAG antibodies. The images were acquired with confocal microscopy. (D) Staining pattern for MLSN-S in cells expressing both MLSN-L and MLSN-S. (E) Localization of MLSN-L in cells expressing MLSN-L and MLSN-S. (F) The merged image of the staining patterns shown in D and E.

References

    1. Harteneck C, Plant T D, Schültz G. Trends Neurosci. 2000;23:159–166. - PubMed
    1. Montell C, Rubin G M. Neuron. 1989;2:1313–1323. - PubMed
    1. Montell C. Science's STKE. 2001. http://stke.sciencemag.org/cgi/content/full/OC_sigtrans , http://stke.sciencemag.org/cgi/content/full/OC_sigtrans;2001/90/re1. ;2001/90/re1. - PubMed
    1. Hardie R C, Minke B. Neuron. 1992;8:643–651. - PubMed
    1. Freichel M, Suh S H, Pfeifer A, Schweig U, Trost C, Weissgerber P, Biel M, Philipp S, Freise D, Droogmans G, et al. Nat Cell Biol. 2001;3:121–127. - PubMed

Publication types

Associated data