Comparative Study
. 2001 Sep;11(9):1567-73.
doi: 10.1101/gr.158301.

cis element/transcription factor analysis (cis/TF): a method for discovering transcription factor/cis element relationships

Affiliations
Comparative Study

cis element/transcription factor analysis (cis/TF): a method for discovering transcription factor/cis element relationships

K Birnbaum et al. Genome Res. 2001 Sep.

Abstract

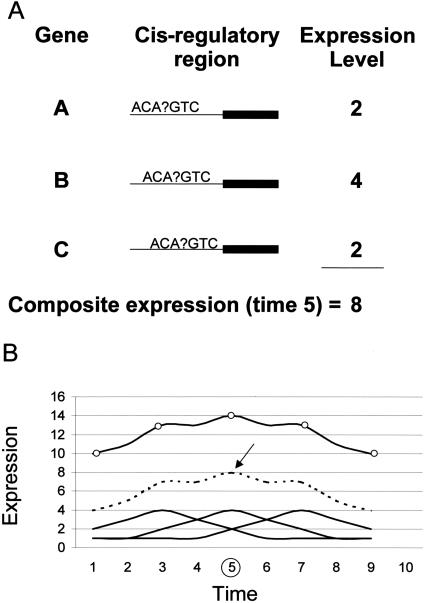
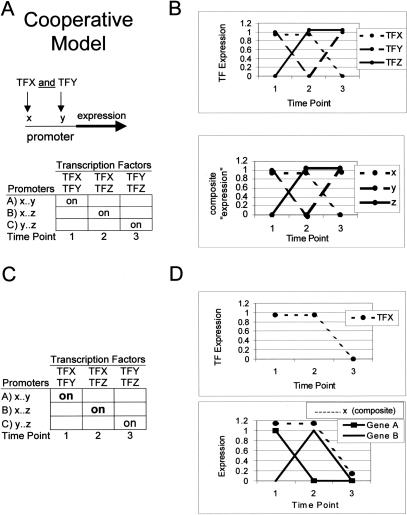
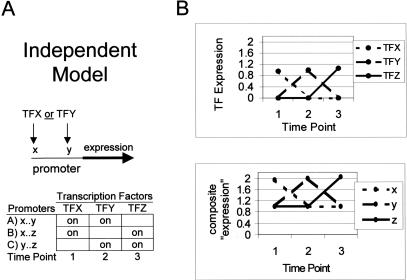
We report a simple new algorithm, cis/TF, that uses genomewide expression data and the full genomic sequence to match transcription factors to their binding sites. Most previous computational methods discovered binding sites by clustering genes having similar expression patterns and then identifying over-represented subsequences in the promoter regions of those genes. By contrast, cis/TF asserts that B is a likely binding site of a transcription factor T if the expression pattern of T is correlated to the composite expression patterns of all genes containing B, even when those genes are not mutually correlated. Thus, our method focuses on binding sites rather than genes. The algorithm has successfully identified experimentally-supported transcription factor binding relationships in tests on several data sets from Saccharomyces cerevisiae.


Figures

Figure 1
Figure 1
The method for correlating a transcription factor with a regulatory motif is based on creating a composite expression of genes for each putative cis element. The regulatory region of all expressed genes are scanned and each frame of a given size (in this case seven) is regarded as a potential cis element. (A) At each time point, a composite expression pattern is generated by adding the expression value of genes carrying a given motif in their regulatory regions (in this case, the summation for ACA?GTC is shown at time 5 where ? can be any base). (B) A series of time points is analyzed and, systematically, composite expression patterns based on potential motifs are compared with the expression of each transcription factor. The expression patterns of genes with ACA?GTC in their promoters, shown as solid lines, is summed to create a composite expression pattern, the broken line directly above. Transcription factor expression, depicted as a solid line with circles, is shown to correlate well with the composite pattern. The best correlations are considered the best transcription factor-binding site hypotheses.
Figure 2
Figure 2
How the program operates under cooperative gene regulation in which two transcription factors binding to their respective cis elements are necessary to induce expression. (A) The top row in the table shows a hypothetical case in which different pairs of transcription factors are expressed at three time points. In the leftmost column are promoters containing the binding sites for transcription factors [e.g., transcription factor X (TFX) binds cis element x]. The internal cells illustrate gene expression patterns given expression of transcription factors and composition of gene promoters. (B) Expression patterns of the transcription factors (TFs; top) and the composite expression of genes grouped by the presence of cis elements in their promoters (x,y,z). A comparison of the top graph and the bottom graph shows that transcription factors correlate with composite patterns to reveal the correct binding relationships. (C,D) Breakdown of composite expression pattern construction. (C) A hypothetical case of cooperative binding as in A and B but with expression of genes with cis element x in bold. (D) Expression of TFX is in the top graph. The expression patterns of the two genes with cis element x are shown as solid lines in the bottom graph and their composite expression is the broken line immediately above. A comparison shows that TFX expression correlates with the composite expression of genes with cis element x in their promoter although TFX alone is not sufficient to induce expression.
Figure 3
Figure 3
(A,B) The case depicts independent gene regulation in which the binding of any one of three transcription factors is sufficient to cause gene expression. (A) As in Fig. 2, the table illustrates how genes with given promoters are induced (internal cells) under a hypothetical transcription factor expression pattern (top row). (B) Transcription factor expression (top) also correlates well with composite expression patterns under the independent binding model.

References

    1. Albrecht G, Mösch HU, Hoffmann B, Reusser U, Braus GH. Monitoring the GCN4 protein-mediated response in the yeast Saccharomyces cerevisiae. J Biol Chem. 1998;273:12696–12702. - PubMed
    1. Arnone MI, Davidson EH. The hardwiring of development: Organization and function of genomic regulatory systems. Development. 1997;128:1851–1864. - PubMed
    1. Brazma A, Jonassen I, Vilo J, Ukkonen E. Predicting gene regulatory elements in silico on a genomic scale. Genome Res. 1998;8:1202–1215. - PMC - PubMed
    1. Bussemaker HJ, Li H, Siggia ED. Regulatory element detection using correlation with genome-wide mRNA expression data. Nat Genet. 2001;27:167–171. - PubMed
    1. Cherry, J.M., Ball, C., Dolinski, K., Dwight, S., Harris, M., Matese, J.C., Sherlock, G., Binkley, G., Jin, H., Weng, S., et al. Saccharomyces Genome Database http://genome-ftp.stanford.edu/pub/yeast/SacchDB/. - PMC - PubMed

Publication types

MeSH terms

Substances

LinkOut - more resources