Comparative Study
. 2001 Sep;11(9):1574-83.
doi: 10.1101/gr.177401.

SGP-1: prediction and validation of homologous genes based on sequence alignments

Affiliations
Comparative Study

SGP-1: prediction and validation of homologous genes based on sequence alignments

T Wiehe et al. Genome Res. 2001 Sep.

Abstract

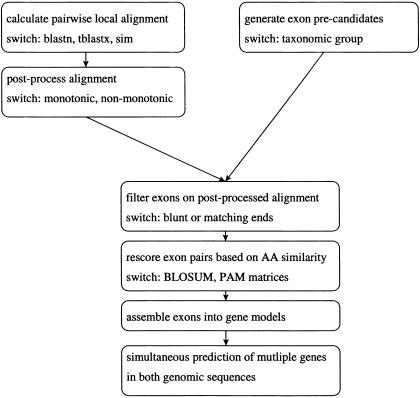
Conventional methods of gene prediction rely on the recognition of DNA-sequence signals, the coding potential or the comparison of a genomic sequence with a cDNA, EST, or protein database. Reasons for limited accuracy in many circumstances are species-specific training and the incompleteness of reference databases. Lately, comparative genome analysis has attracted increasing attention. Several analysis tools that are based on human/mouse comparisons are already available. Here, we present a program for the prediction of protein-coding genes, termed SGP-1 (Syntenic Gene Prediction), which is based on the similarity of homologous genomic sequences. In contrast to most existing tools, the accuracy of depends little on species-specific properties such as codon usage or the nucleotide distribution. may therefore be applied to nonstandard model organisms in vertebrates as well as in plants, without the need for extensive parameter training. In addition to predicting genes in large-scale genomic sequences, the program may be useful to validate gene structure annotations from databases. To this end, SGP-1 output also contains comparisons between predicted and annotated gene structures in HTML format. The program can be accessed via a Web server at http://soft.ice.mpg.de/sgp-1. The source code, written in ANSI C, is available on request from the authors.


Figures

Figure 1
Figure 1
Flowchart of SGP-1.
Figure 2
Figure 2
Sequence similarity between three homologous human/mouse genomic regions, which diverged at different evolutionary rates. (a) ERCC2 locus (Accession nos. L47234; L47235). (b) MHC-II region (Accession nos. X87344; AF100956, AF027865). (c) HOX cluster (Accession nos. AC009336; L1084). Abscissa: sequence position along the human sequence. Ordinate: sequence position along the mouse sequence (upper panels) and identity of locally aligned fragments (middle panels). For better illustration, the lower panels show a sliding-window-plot of the identity. The position of exons is indicated by grey vertical lines. Note that the HOX cluster is highly conserved also in intronic and intergenic parts of the sequence.
Figure 3
Figure 3
Distributions of score differences in data set S1. Shown is the distribution for the scores of acceptors (a) and donors (d) and for the codon bias (c). Codon bias was calculated with CodonW (Peden, 1997) separately for each pair of homologous coding sequences in set S1. To bring the numerical values for a,c, and d on the same scale, we divided the numbers obtained by the respective sample standard deviation σi, i = a,d,c. Based on a two-tailed Student's t-test, the hypothesis that the mean of the distribution is zero is not rejected for acceptors nor for donors. However, it is rejected for codon bias (P = 4.5×10⁻⁶).
Figure 4
Figure 4
Example of potential annotation errors. Comparison of GenBank annotation (CDS field) and SGP-1 prediction for human and mouse insulin genes (accession nos. M10039 and X04724). From left to right, the fields are identifier (1), source (2), feature (3), sequence positions of beginning and end of a coding exon (4 and 5), score (6), strand (7), reading frame (8), grouping (9), and sequence (10). Discrepancies between annotation and prediction are marked by black circles around murine donor and acceptor positions and reading frame for exon 2. Capital letters indicate the coding sequence.
Figure 5
Figure 5
(Left panel) Alignment of two 230-kb regions on chromosomes 3 (abszissa) and 5 (ordinate) of Arabidopsis thaliana. (Right panel) CDS exon structure (filled boxes and grey bands) of a gene family with two copies on chromosome 5 and one copy on chromosome 3.
Figure 6
Figure 6
Relaxed filtering of precandidates. (a) A blunt end, but complete coverage by the alignment. (b) A blunt end and partial coverage by the alignment. Setting parameters d and/or x to a value >0 retains precandidates with unaligned splice sites.

References

    1. Abril J, Wiehe T, Guigó R. APLOT: 2D-Visualization of genome annotations. 1999. http://www1.imim.es/software/gfftools/APLOT.html http://www1.imim.es/software/gfftools/APLOT.html.
    1. Aho A, Corasick M. Efficient string matching: An aid to bibliographic search. Comm ACM. 1975;18:333–340.
    1. Altschul SF, Gish W, Miller W, Myers EW, Lipman DJ. Basic local alignment search tool. J Mol Biol. 1990;215:403–410. - PubMed
    1. Bafna V, Huson DH. Proceedings of the Eighth International Conference on Intelligent Systems for Molecular Biology. Menlo Park, CA: AAAI Press; 2000. The conserved exon method for gene finding; pp. 3–12. - PubMed
    1. Batzoglou S, Pachter L, Meserov J, Berger B, Lander ES. Human and mouse gene structure comparative analysis and applications to exon prediction. Genome Res. 2000;10:950–958. - PMC - PubMed

Publication types