. 2001 Sep 15;21(18):7046-52.
doi: 10.1523/JNEUROSCI.21-18-07046.2001.

Interleukin-1beta promotes repair of the CNS

Affiliations

Interleukin-1beta promotes repair of the CNS

J L Mason et al. J Neurosci. .

Abstract

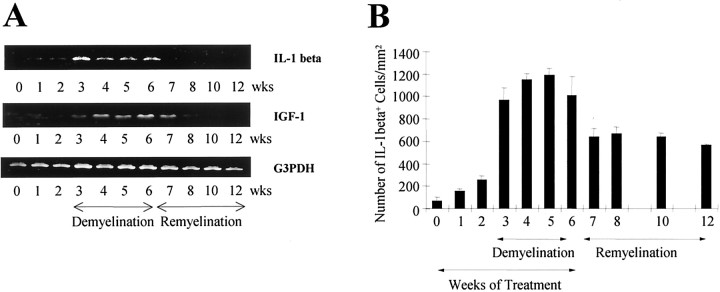
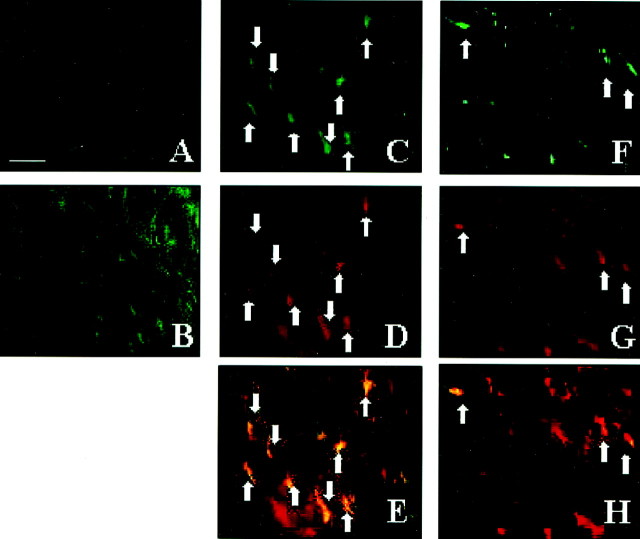
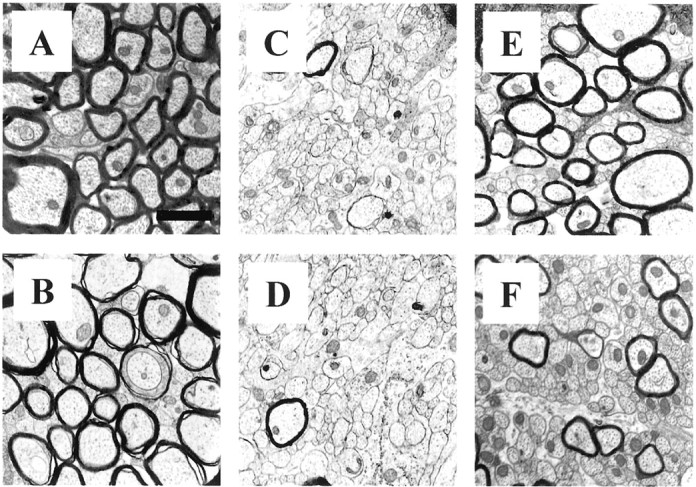
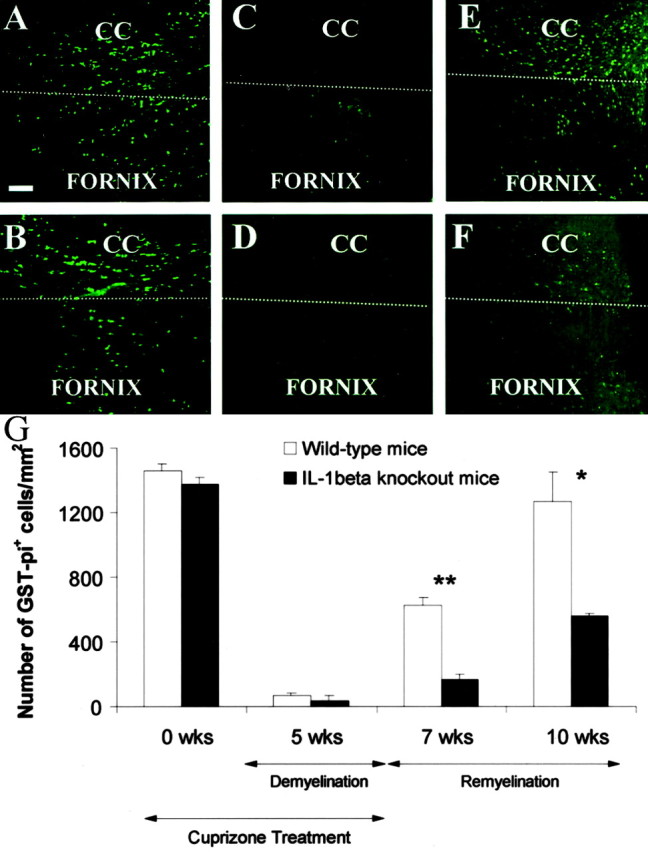
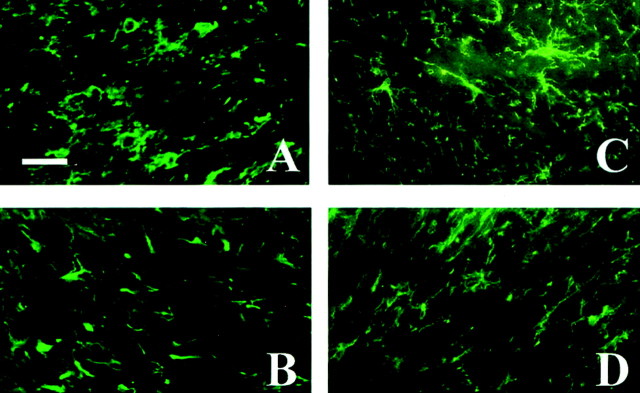
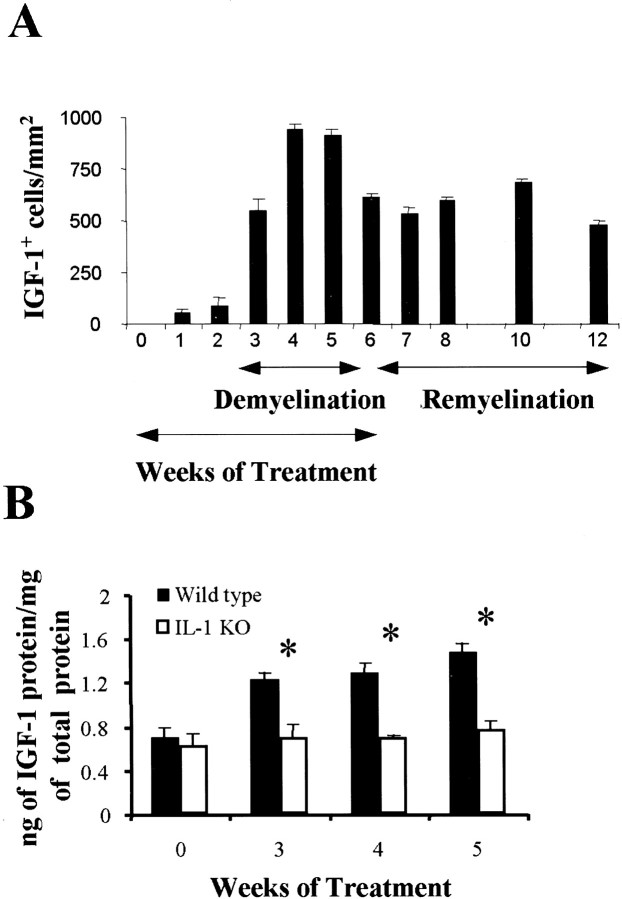
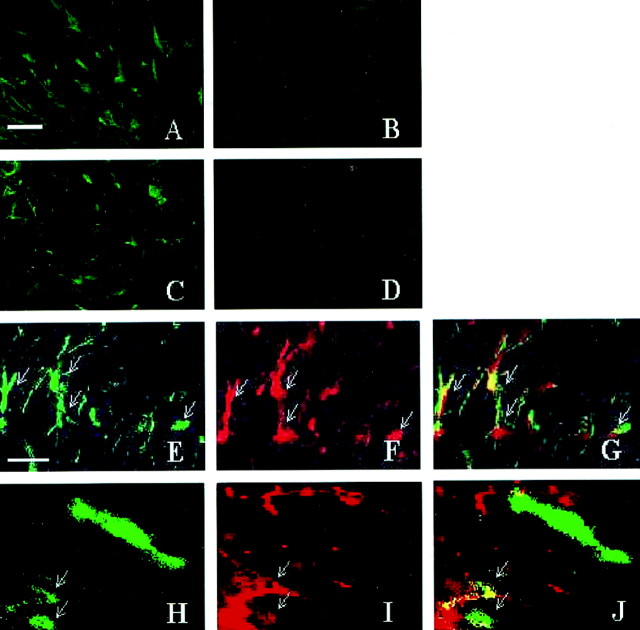
Interleukin-1beta (IL-1beta) is a proinflammatory cytokine associated with the pathophysiology of demyelinating disorders such as multiple sclerosis and viral infections of the CNS. However, we demonstrate here that IL-1beta appears to promote remyelination in the adult CNS. In IL-1beta(-/-) mice, acute demyelination progressed similarly to wild-type mice and showed parallel mature oligodendrocyte depletion, microglia-macrophage accumulation, and the appearance of oligodendrocyte precursors. In contrast, IL-1beta(-/-) mice failed to remyelinate properly, and this appeared to correlate with a lack of insulin-like growth factor-1 (IGF-1) production by microglia-macrophages and astrocytes and to a profound delay of precursors to differentiate into mature oligodendrocytes. Thus, IL-1beta may be crucial to the repair of the CNS, presumably through the induction of astrocyte and microglia-macrophage-derived IGF-1.


Figures

Fig. 1.
Fig. 1.
Expression of IL-1β during demyelination–remyelination in wild-type mice. A, Reverse transcription-PCR of RNA extracted from brains of mice at weekly intervals was examined for IL-1β and IGF-1. Mice were exposed to cuprizone for 6 weeks and allowed to recover. A representative example of three time course experiments is illustrated.B, The number of IL-1β+ cells in the corpus callosum at the level of the fornix. The mean and SEM bars representing the number of IL-1β+ cells per square millimeter are plotted for the triplicate set of samples.
Fig. 2.
Fig. 2.
Most microglia–macrophages and some astrocytes express IL-1β during demyelination–remyelination in wild-type mice. A, Few or no IL-1β+ cells are present in the untreated corpus callosum. B, A large accumulation of IL-1β+ cells begins at week 3 in the medial region of the corpus callosum posterior to the fornix.C–E, Representative sections demonstrating the colocalization (arrows) of IL-1β-expressing cells (green-stained cells in C) to nearly all of the Mac-1+ macrophages (red-stained cells in D and overlaid inE) in the corpus callosum at week 4.F–H, The colocalization (arrows) of a few IL-1β-expressing cells (green-stained cells in F) to GFAP+ astrocytes (red-stained cells in G and overlaid inH) in the corpus callosum. Scale bar, 30 μm.
Fig. 3.
Fig. 3.
Representative electron micrographs of the myelinated, demyelinated, and remyelinated axons in the corpus callosum of wild-type and IL-1β−/− mice. Almost all axons are myelinated in the corpus callosum of untreated wild-type (A) andIL-1β−/− (B) mice. Negligible number of myelinated axons, corresponding to peak demyelination, are present in the corpus callosum of 5 week treated wild-type (C) andIL-1β−/− (D) mice.E, Wild-type mice show that a large portion of the axons in the corpus callosum have remyelinated, butIL-1β−/− mice show fewer remyelinated axons at week 10 (F), 4 weeks after removal of cuprizone. Scale bar, 1.2 μm.
Fig. 4.
Fig. 4.
GST-Pi+ mature oligodendrocytes in the corpus callosum of wild-type andIL-1β−/− mice during demyelination and remyelination. GST-Pi+ mature oligodendrocytes in the corpus callosum of untreated wild-type (A) and IL-1β−/− (B) mice at 0 weeks. Mature oligodendrocyte recovery of wild-type (C) and IL-1β−/−(D) mice at 5 weeks of treatment. Recovery of GST-Pi+ cells in the corpus callosum of wild-type (E) and IL-1β−/−(F) mice at 10 weeks. G, The mean and SEM bars representing the number of GST-Pi+cells per square millimeter are plotted for the triplicate set of samples. Scale bar, 50 μm. CC, Corpus callosum. Thewhite dashed line separates the corpus callosum and fornix. *p < 0.005; **p < 0.0005.
Fig. 5.
Fig. 5.
The presence of NG2+ cells during demyelination and remyelination inIL-1β−/− mice. NG2+oligodendrocytes accumulate in the corpus callosum of wild-type (A) and IL-1β-deficient (B) mice after 5 weeks of cuprizone treatment. A reduction in the number of NG2+ oligodendrocyte progenitors (450 ± 30 cells/mm2) in the corpus callosum was observed in wild-type mice (C) (only stained cells with nuclei were counted). This was in contrast to the continued presence of progenitors (703 ± 38 cells/mm2) in the corpus callosum ofIL-1β−/− mice after 1 week of recovery after 6 weeks of cuprizone treatment (D). Scale bar, 20 μm.
Fig. 6.
Fig. 6.
The number of IGF-1+ cells and amount of IGF-1 protein increase within a demyelinating corpus callosum in wild-type mice but not in IL-1β−/−mice. A, The mean and SEM bars representing the number of IGF-1+ cells per square millimeter in wild-type mice is plotted for the duplicate set of samples (*p < 0.001). B, The mean and SEM bars representing the amount of IGF-1 protein within the corpus callosum of wild-type and IL-1β−/− mice is plotted for the triplicate set of samples. KO, Knock-out.
Fig. 7.
Fig. 7.
The absence of IGF-1+astrocytes and microglia–macrophages during demyelination and remyelination in IL-1β−/− mice. IGF-1+ cells appear in the corpus callosum of wild-type mice (A) but not in IL-1β-deficient mice (B) after 5 weeks of treatment. IGF-1+ cells remain in the corpus callosum of wild-type mice (C) undergoing remyelination but are absent in IL-1β-deficient mice (D) after 1 week of recovery after 6 weeks of cuprizone treatment.E–J, Representative sections from wild-type mice demonstrating the colocalization of IGF-1 to GFAP+cells and Mac-1+ cells within the demyelinating corpus callosum at 4 weeks. E–G, The colocalization (arrows) of IGF-1+ cells (green-stained cells in E) to nearly all of the GFAP+ astrocytes (red-stained cells in F and overlaid inG) within the lesion. H–J, The colocalization (arrows) of a few IGF-1+ cells (green-stainedcells in H) to Mac-1+microglia–macrophages (red-stained cells inI and overlaid in J) within the lesion. Scale bars: A–D, 20 μm; E–H, 10 μm.

References

    1. Araujo DM, Cotman CW. Basic FGF in astroglial, microglial, and neuronal cultures: characterization of binding sites and modulation of release by lymphokines and trophic factors. J Neurosci. 1992;12:1668–1678. - PMC - PubMed
    1. Arkins S, Rebeiz N, Biragyn A, Reese DL, Kelley KW. Murine macrophages express abundant insulin-like growth factor-1 class I Ea and Eb transcripts. Endocrinology. 1993;133:2334–2343. - PubMed
    1. Bauer J, Berkenbosch F, Van Dam A-M, Dijkstra CD. Demonstration of interleukin-1β in Lewis rat brain during experimental allergic encephalomyelitis by immunohistochemistry at the light and ultrastructural level. J Neuroimmunol. 1993;48:13–22. - PubMed
    1. Bencsik A, Malcus C, Akaoka H, Giraudon P, Belin M-F, Bernard A. Selective induction of cytokines in mouse brain infected with canine distemper virus: structural, cellular and temporal expression. J Neuroimmunol. 1996;65:1–9. - PubMed
    1. Blakemore WF. Remyelination of the superior cerebellar peduncle in the mouse following demyelination induced by feeding cuprizone. J Neurol Sci. 1973;20:73–83. - PubMed

Publication types

MeSH terms

LinkOut - more resources