. 2001 Sep 15;21(18):7273-83.
doi: 10.1523/JNEUROSCI.21-18-07273.2001.

Hypocretin-2-saporin lesions of the lateral hypothalamus produce narcoleptic-like sleep behavior in the rat

Affiliations

Hypocretin-2-saporin lesions of the lateral hypothalamus produce narcoleptic-like sleep behavior in the rat

D Gerashchenko et al. J Neurosci. .

Abstract

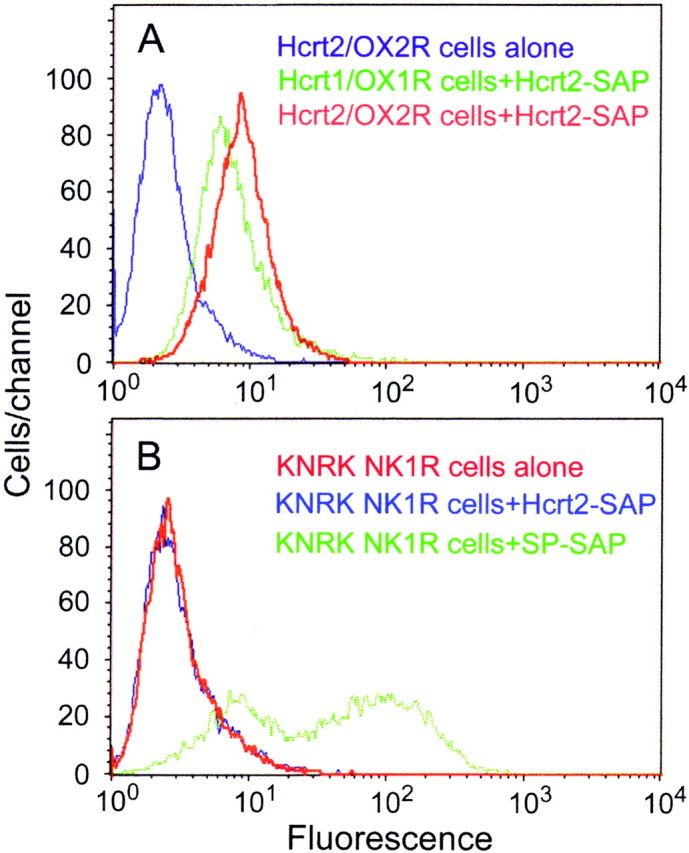
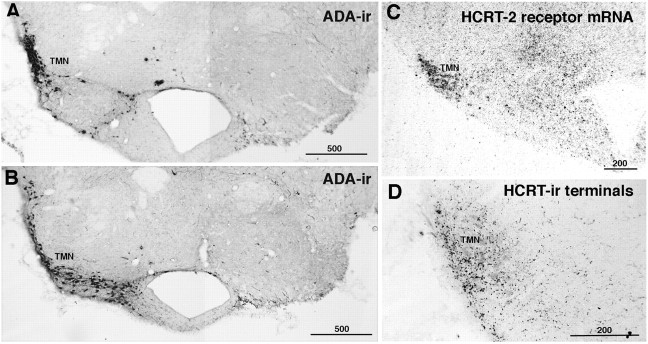
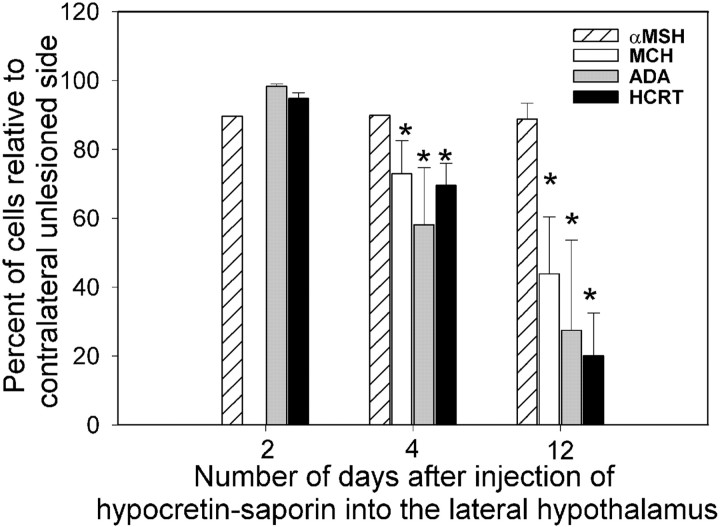
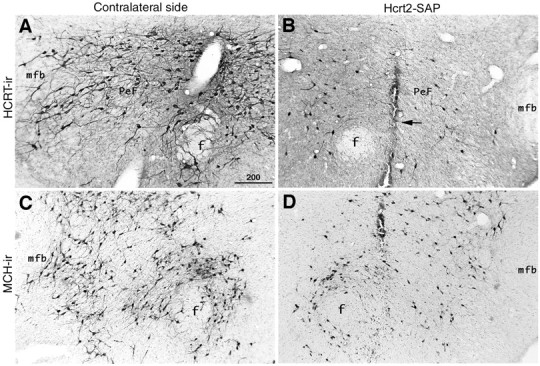
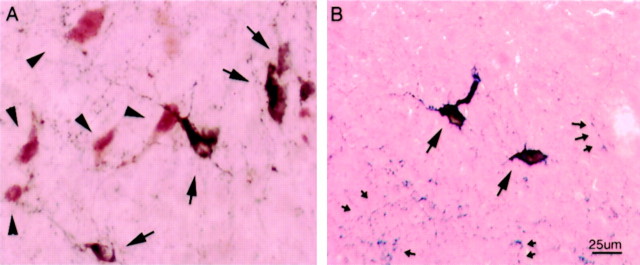
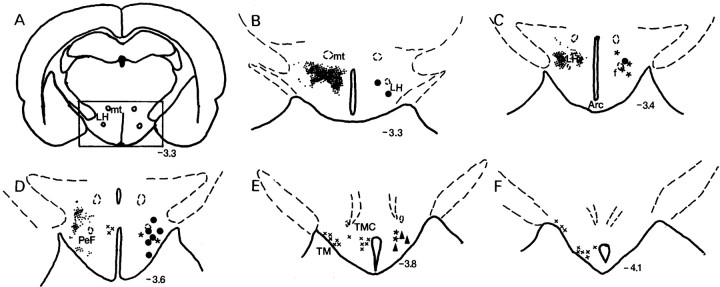
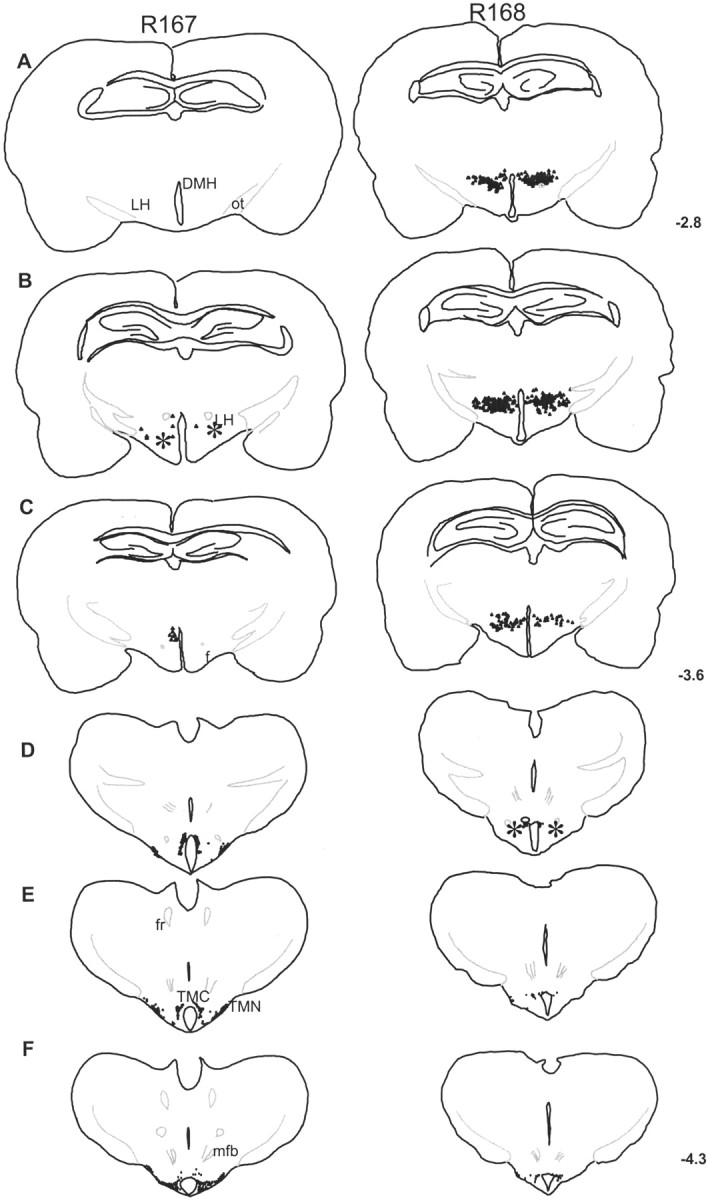
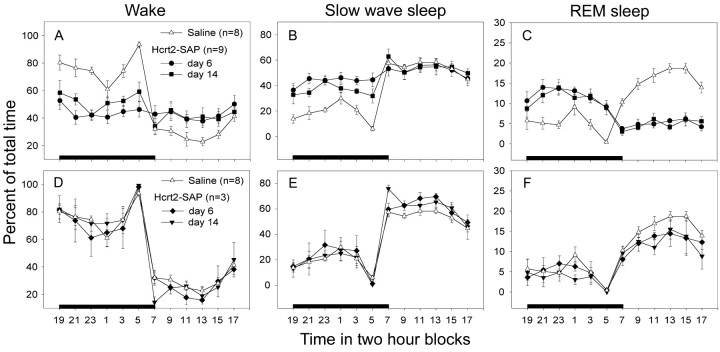
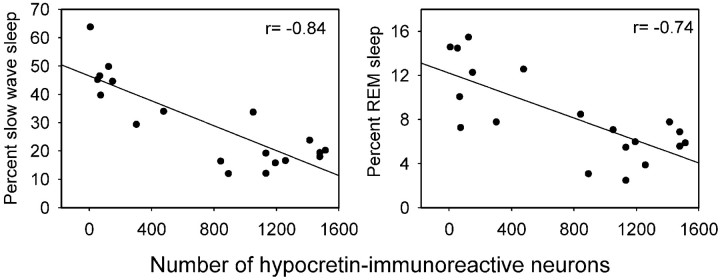
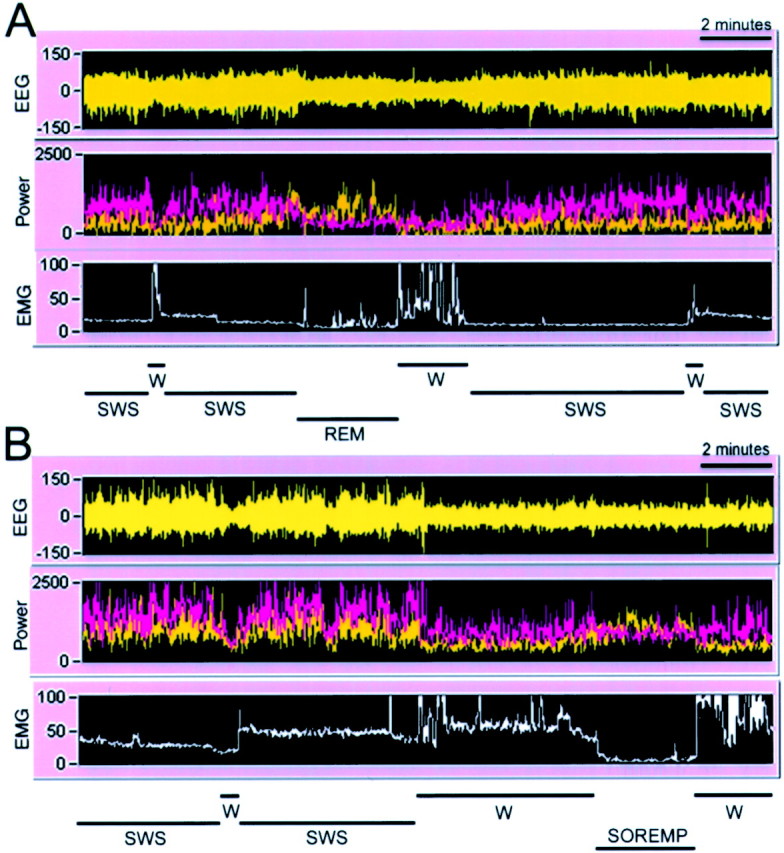
Hypocretins (Hcrts) are recently discovered peptides linked to the human sleep disorder narcolepsy. Humans with narcolepsy have decreased numbers of Hcrt neurons and Hcrt-null mice also have narcoleptic symptoms. Hcrt neurons are located only in the lateral hypothalamus (LH) but neither electrolytic nor pharmacological lesions of this or any other brain region have produced narcoleptic-like sleep, suggesting that specific neurons need to be destroyed. Hcrt neurons express the Hcrt receptor, and to facilitate lesioning these neurons, the endogenous ligand hypocretin-2/orexin B (Hcrt2) was conjugated to the ribosome-inactivating protein saporin (SAP). In vitro binding studies indicated specificity of the Hcrt2-SAP because it preferentially bound to Chinese hamster ovary cells containing the Hcrt/orexin receptor 2 (HcrtR2/OX(2)R) or the Hcrt/orexin receptor 1 (HcrtR1/OX(1)R) but not to Kirsten murine sarcoma virus transformed rat kidney epithelial (KNRK) cells stably transfected with the substance P (neurokinin-1) receptor. Administration of the toxin to the LH, in which the receptor is known to be present, eliminated some neurons (Hcrt, melanin-concentrating hormone, and adenosine deaminase-containing neurons) but not others (a-melanocyte-stimulating hormone), indicating specificity of the toxin in vivo. When the toxin was administered to the LH, rats had increased slow-wave sleep, rapid-eye movement (REM) sleep, and sleep-onset REM sleep periods. These behavioral changes were negatively correlated with the loss of Hcrt-containing neurons but not with the loss of adenosine deaminase-immunoreactive neurons. These findings indicate that damage to the LH that also causes a substantial loss of Hcrt neurons is likely to produce the multiple sleep disturbances that occur in narcolepsy.


Figures

Fig. 1.
Fig. 1.
FACS analysis of Hcrt2-SAP binding to Hcrt receptor-transfected cells and cells expressing the NK-1 receptor. Binding was measured using FITC-labeled anti-saporin antibody to determine whether the entire conjugate was bound to the receptors.A, Hcrt2-SAP binding to cells transfected with the HcrtR1/OX1 receptor (green line) or the HcrtR2/OX2 receptor (red line). HcrtR2/OX2 cells not exposed to Hcrt2-SAP lack binding (blue line). B, Hcrt2-SAP does not bind to cells transfected with the NK-1 receptor (blue line). As a positive control, SP-SAP is shown binding to these cells.
Fig. 2.
Fig. 2.
Effects of Hcrt2-SAP on Hcrt receptor mRNA-containing neurons in the TMN. Virtually all of the TMN neurons contain adenosine deaminase (A, B,left side). Hcrt receptor mRNA is present in these neurons (C), and Hcrt fibers and terminals innervate this nucleus (D). A unilateral administration of Hcrt2-SAP to the TMN eliminated these neurons (A, B, right side). Scale bars are in micrometers.
Fig. 3.
Fig. 3.
Time course of the effects of Hcrt2-SAP on markers of neuronal phenotypes in the posterior hypothalamus. A unilateral injection of Hcrt2-SAP (490 ng/0.5 μl in a volume of 0.5 μl) was made to the LH, and rats were killed 2, 4, or 12 d later. Adjacent tissue sections (30 μm thick) were processed for visualization of Hcrt-, MCH-, a-MSH-, or ADA-containing neurons. The contralateral uninjected side served as a control. There was a time-dependent loss of neurons in the injection zone beginning on day 4 after injection, which is consistent with the effects of saporin conjugated to other ligands. *p < 0.05.
Fig. 4.
Fig. 4.
Effects of Hcrt2-SAP on hypocretin (HCRT-ir) (A, B) and melanin-concentrating hormone (MCH-ir) (C, D) -containing neurons in the LH.B and D represent the side receiving the Hcrt2-SAP injection; A and C represent the contralateral, uninjected side. The arrow inB points to the micropipette tract. The tissue is from a representative rat that was examined 12 d after unilateral microinjection of Hcrt2-SAP in the LH. Adjacent tissue sections were processed for visualization of Hcrt- or MCH-immunoreactive neurons.f, Fornix; mfb, medial forebrain bundle;PeF, perifornical area. The scale bar inA (in micrometers) applies to the other photomicrographs also.
Fig. 5.
Fig. 5.
Effects of Hcrt2-SAP on a-MSH (arrows) and Hcrt (arrowheads) neurons in the LH. A represents the contralateral uninjected side and B represents the side receiving the Hcrt2-SAP injection. Tissue sections from rats with a unilateral injection of Hcrt2-SAP in the LH were processed for visualization of both Hcrt (brown reaction product) and a-MSH (black-brown reaction product) neurons. Note the close proximity of the Hcrt neurons to the a-MSH neurons (A) and the lack of Hcrt-ir neurons in the side administered Hcrt2-SAP (B). The small arrows inB identify a-MSH terminals and varicosities.
Fig. 6.
Fig. 6.
Camera lucida drawings of injection sites as well as Hcrt-ir neurons (small dots) in the LH.Large filled circles represent the sites for which application of Hcrt2-SAP produced >60% Hcrt cell loss (Hcrt-x rats).Filled triangles represent the sites for which Hcrt2-SAP injections produced <30% Hcrt cell loss. Asterisksrepresent the saline injection sites. The location of Hcrt neurons (small dots) and ADA-ir neurons (marked by ×) is shown on the left side of the drawings.Arc, Arcuate nucleus; f, fornix;mt, mammillothalamic tract; PeF, perifornical area; TM, tuberomammillary nucleus; TMC, TM central portion. The nomenclature is according to the rat atlas of Paxinos and Watson (1986).
Fig. 7.
Fig. 7.
Camera lucida drawing of the posterior hypothalamus from two representative rats with Hcrt2-SAP injections.Asterisks denote the site of injection. In rat R167, the toxin eliminated virtually all of the Hcrt-ir cells (99% loss) but spared the adenosine deaminase-ir cells in the TMN (0% loss). In rat R168, the administration of the toxin to a slightly more caudal region produced a 30% loss of Hcrt-ir cells and a 63% loss of adenosine deaminase-ir cells in the TMN. DMH, Dorsomedial hypothalamus; mfb, medial forebrain bundle;ot, optic tract; TMC, tuberomammillary nucleus central portion.
Fig. 8.
Fig. 8.
Photomicrographs of hypothalamic sections depicting Hcrt receptor mRNA (A, D), Hcrt-ir neurons (B, E), and Hcrt-ir fibers in the locus ceruleus (C,F). In A–C, tissue from saline-treated rats is depicted. D–F depict tissue from a representative rat with Hcrt2-SAP administered to the LH.A depicts an autoradiogram image of Hcrt receptor mRNA labeling in the LH (coronal section). The region outlined by thebox in A represents the area in which Hcrt-ir neurons are present (B). Images inB and F are presented in reverse contrast. Hcrt2-SAP applied to the LH eliminated Hcrt receptor mRNA labeling (D) and Hcrt-ir neurons (E). Elimination of the Hcrt-ir neurons produced a loss of Hcrt-ir fibers at target sites such as the locus ceruleus (LC). In control rats, the LC is heavily innervated by Hcrt-ir fibers (C), but this innervation is lost after Hcrt2-SAP lesions of the Hcrt-ir neurons in the LH (F). 3V, Third ventricle;4V, fourth ventricle; Amyg, amygdala;f, fornix; MHb, medial habenula;mt, mammillothalamic tract; PeF, perifornical nucleus.
Fig. 9.
Fig. 9.
Mean (±SEM) percentage of wakefulness, SWS, and REM sleep during 24 hr in rats administered Hcrt2-SAP or saline in the posterior hypothalamus. The 24 hr are represented in 2 hr blocks. Thedark bar represents the 12 hr light-off period. Animals with a >60% decline in the number of Hcrt cells (A–C) experienced significantly more SWS and REM sleep at night compared with saline-treated rats. During the day the lesioned rats had as much SWS as controls but REM sleep was decreased. The night-time increase in sleep served to lessen the diurnal variation in sleep. In animals that had partial loss of Hcrt neurons (D–F), there was no change in sleep.
Fig. 10.
Fig. 10.
Relationship between sleep states (SWS and REM sleep) during the dark period and the numbers of Hcrt-ir cells in the LH. There was a significant inverse relationship between the numbers of Hcrt cells and sleep states.
Fig. 11.
Fig. 11.
Alternation between wakefulness (W), SWS, and REM sleep in rats administered saline (A) or Hcrt2-SAP (B) into the LH. The figure represents a 20 min segment of a sleep–wake recording during the night (9:00 P.M.).A and B consist of a recording of the EEG, power of the EEG in the δ (0.3–4 Hz; pink) and θ (4–12 Hz; yellow) bands, and integrated activity of the nuchal muscles (EMG). The sleep–wake state determination, based on the relationship of the EEG, power, and EMG activity, is indicated at the bottom of each panel.A depicts a normal transition from SWS to REM sleep to wakefulness. B depicts a SOREMP exhibited by a Hcrt2-SAP-treated rat with a 90% loss of Hcrt-ir neurons. The SOREMP is identified by a loss of EMG tone (near zero), by increased θ activity, by a reduction in δ activity (pink band in B), and by an EEG amplitude that is similar to wakefulness. These criteria are used to identify REM sleep, including SOREMP, and they are not present during wakefulness or SWS. Note that the first brief bout of wakefulness in Bcannot be construed as REM sleep, because there is no θ activity and the EMG tone is rising, denoting that the rat woke up, albeit briefly.

References

    1. Abrahamson EE, Moore RY. The posterior hypothalamic area: chemoarchitecture and afferent connections. Brain Res. 2001;889:1–22. - PubMed
    1. Abrahamson EE, Leak RK, Moore RY. The suprachiasmatic nucleus projects to posterior hypothalamic arousal systems. NeuroReport. 2001;12:435–440. - PubMed
    1. Aldrich MS. The neurobiology of narcolepsy. Trends Neurosci. 1991;14:235–239. - PubMed
    1. Bergamaschi G, Perfetti V, Tonon L, Novella A, Lucotti C, Danova M, Glennie MJ, Merlini G, Cazzola M. Saporin, a ribosome-inactivating protein used to prepare immunotoxins, induces cell death via apoptosis. Br J Haematol. 1996;93:789–794. - PubMed
    1. Borbely AA. Sleep homeostasis and models of sleep regulation. In: Kryger MH, Roth T, Dement WC, editors. Principles and practice of sleep medicine. Saunders; Toronto: 1994. pp. 309–320.

Publication types

MeSH terms