Clinical Trial
. 2001 Sep 15;21(18):7416-27.
doi: 10.1523/JNEUROSCI.21-18-07416.2001.

Importance of temporal cues for tactile spatial- frequency discrimination

Affiliations
Clinical Trial

Importance of temporal cues for tactile spatial- frequency discrimination

E Gamzu et al. J Neurosci. .

Erratum in

  • J Neurosci 2001 Oct 15;21(20):1a

Abstract

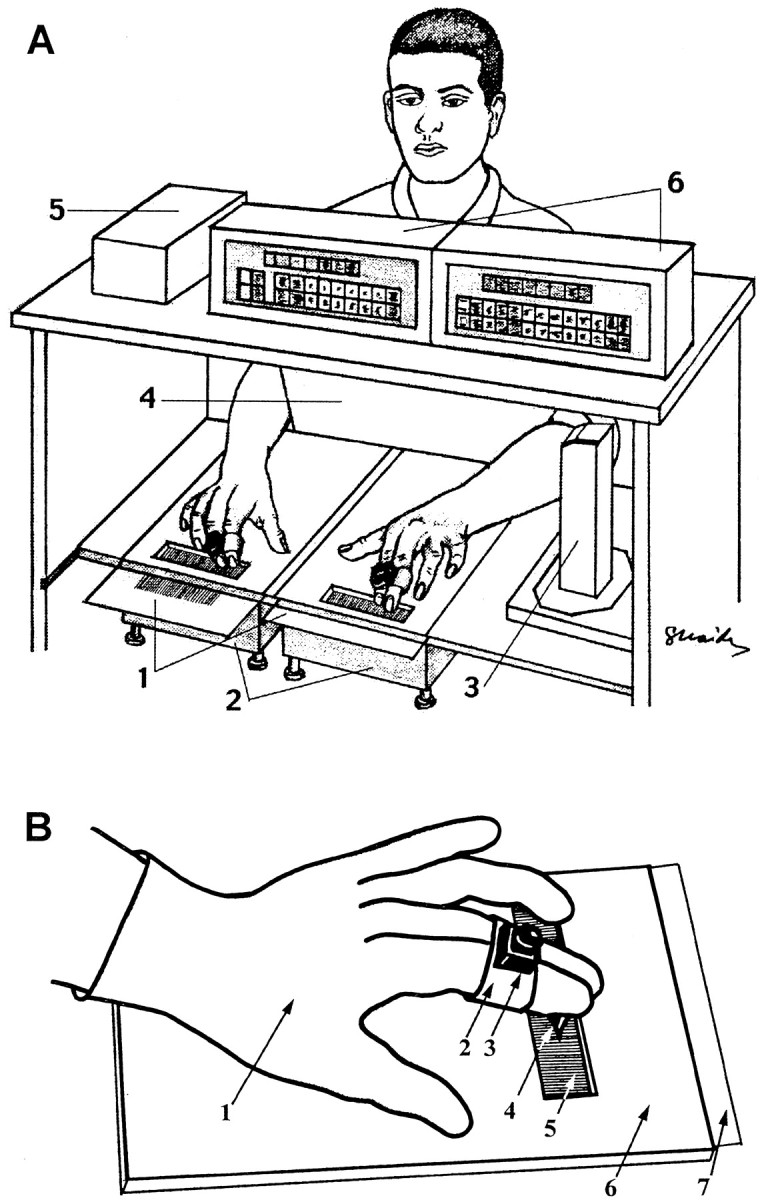
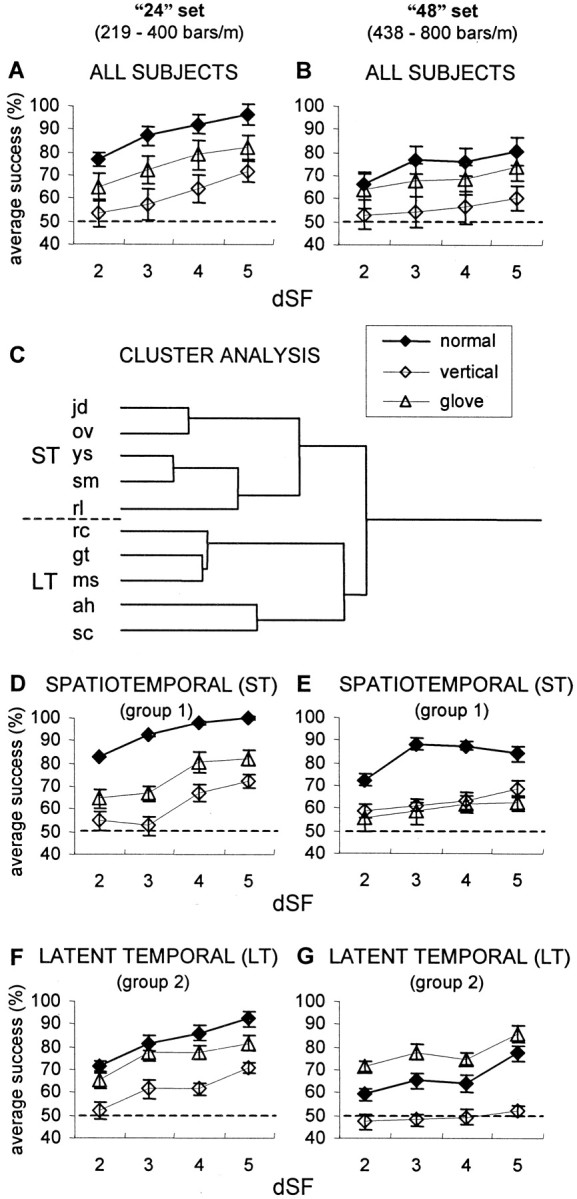
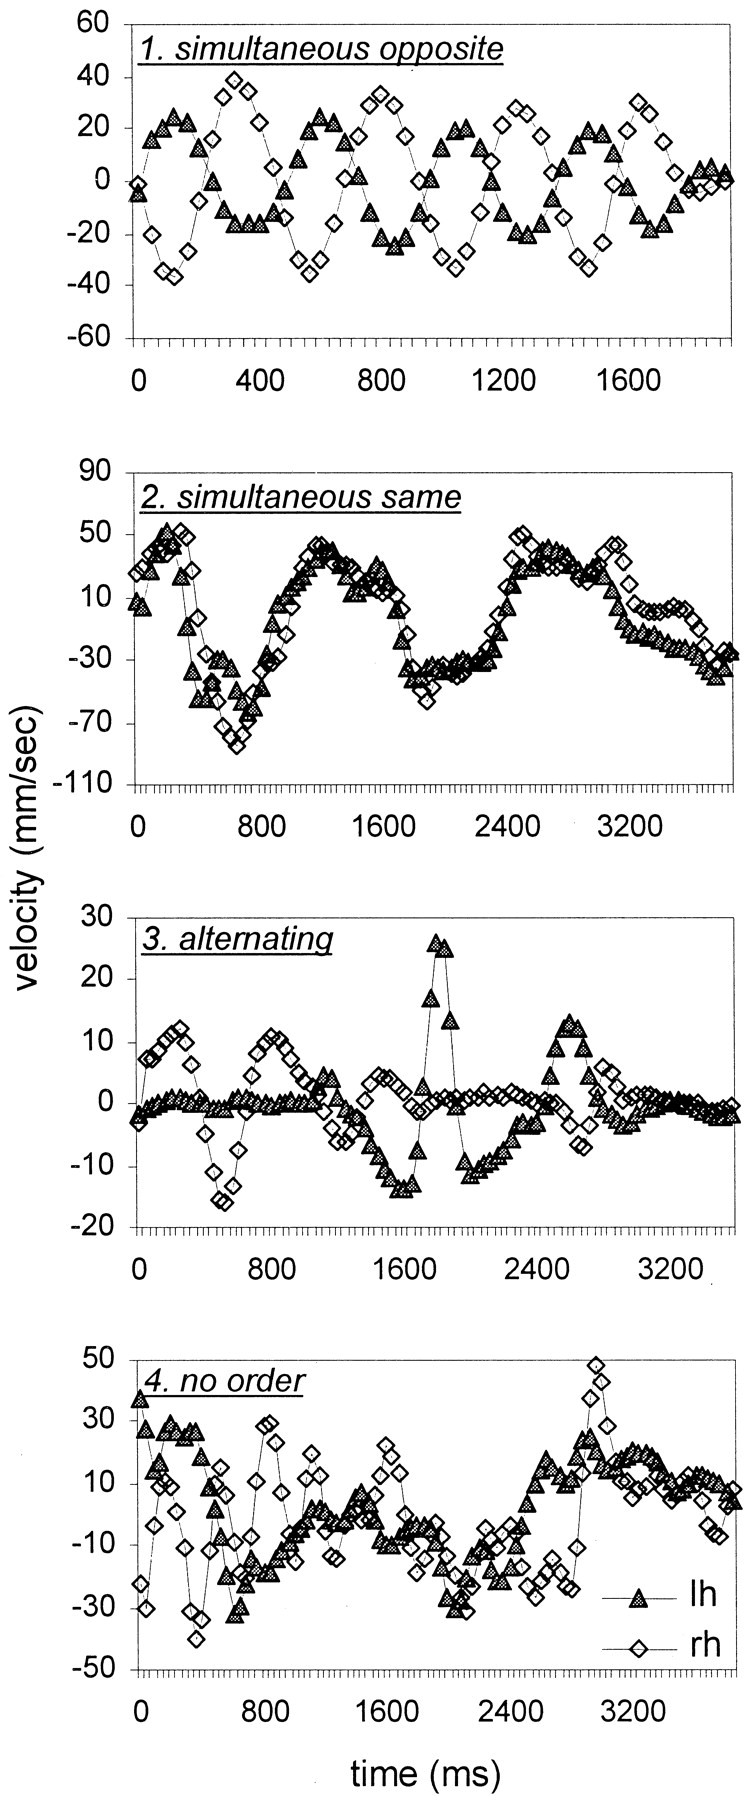
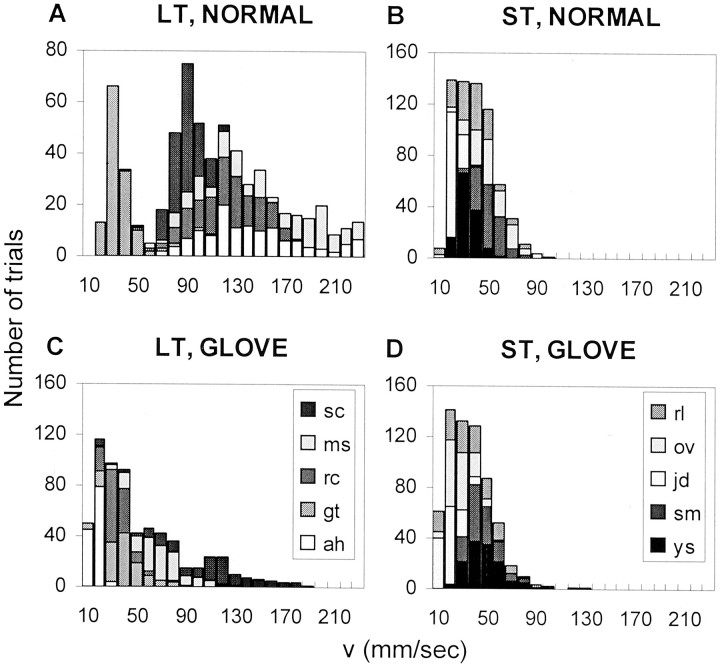
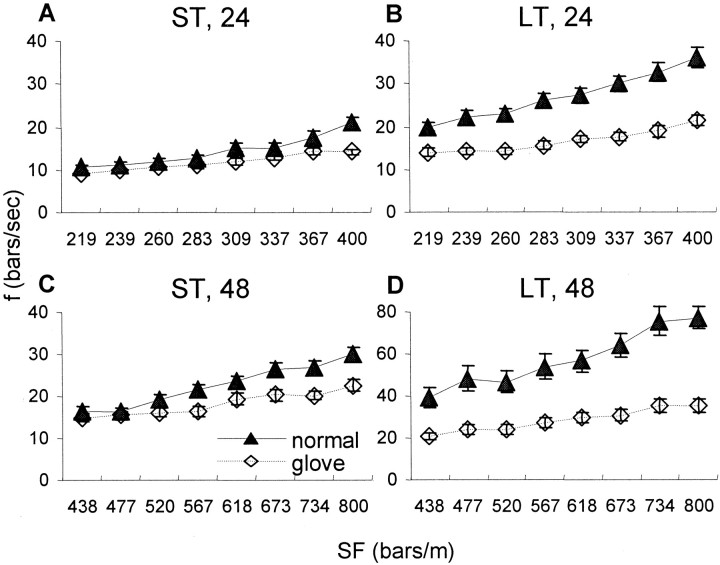
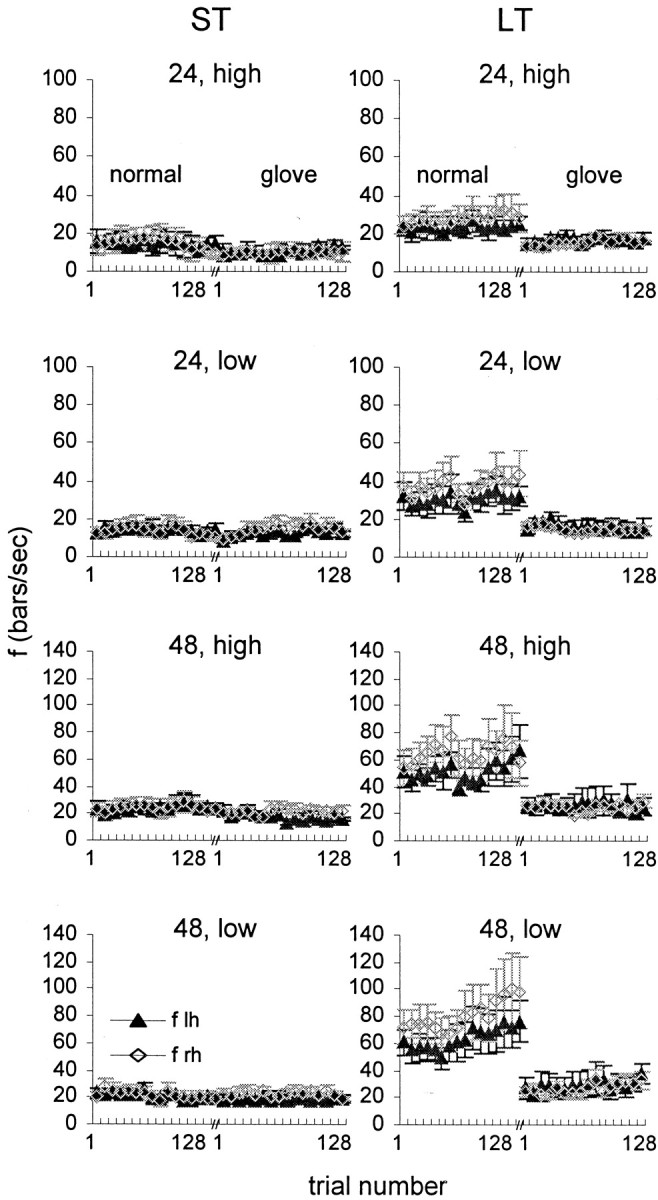
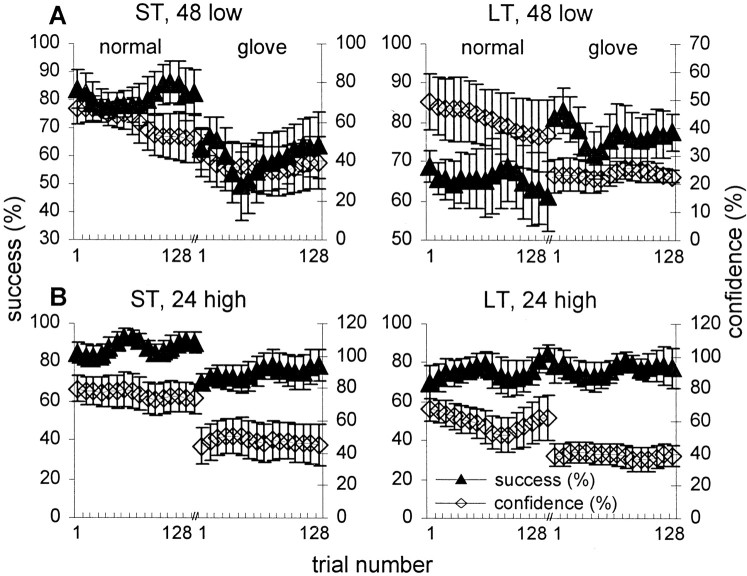
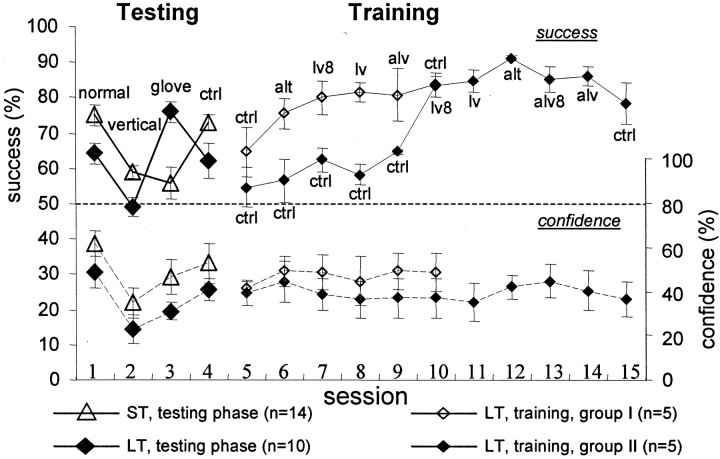
While scanning a textured surface with fingers, tactile information is encoded both spatially, by differential activation of adjacent receptors, and temporally, by changes in receptor activation during movements of the fingers across the surface. We used a tactile discrimination task to examine the dependence of human tactile perception on the availability of spatial and temporal cues. Subjects discriminated between spatial frequencies of metal gratings presented simultaneously to both hands. Tactile temporal cues were eliminated by preventing lateral hand movements; tactile spatial cues were eliminated by using gloves with an attached rubber pin. Analysis revealed separation of the subjects into two groups: "spatiotemporal" (ST) and "latent-temporal" (LT). Under normal conditions, the performance of ST subjects was significantly better than that of the LT subjects. Prevention of lateral movements impaired performance of both ST and LT subjects. However, when only temporal cues were available, the performance of ST subjects was significantly impaired, whereas that of the LT subjects either improved or did not change. Under the latter condition, LT subjects changed strategy to scanning with alternating hands, at velocities similar to the velocities normally used by ST subjects. These velocities generated temporal frequencies between 15 and 30 Hz. The LT subjects were unaware of their improved performance. Nine of ten LT subjects significantly improved their performance under normal conditions when trained to scan gratings using alternating hands and velocities similar to those used by ST subjects. We conclude that (1) temporal cues are essential for spatial-frequency discrimination, (2) human subjects vary in the tactile strategies they use for texture exploration, and (3) poor tactile performers can significantly improve by using strategies that emphasize temporal cues.


Figures

Fig. 1.
Fig. 1.
Experimental apparatus. A, General scheme. 1, Grating surfaces; 2,electronic scales; 3, component of the location detector containing infrared transmitter and ultrasonic receiver;4, screen; 5, interface box of the location detector; and 6, monitors and computer interface of electronic scales. B, Scanning with gloves.1, Latex glove; 2, Velcro band holding the sensor of the location detector; 3, sensor of the location detector; 4, rubber pin; 5,grating; 6, Plexiglas board; and 7,grating surface (inserted underneath the Plexiglas board).
Fig. 2.
Fig. 2.
Effect of scanning type on average psychometric curves. A, Average performance of the initial 10 subjects on the 24 low-amplitude sets of gratings. For each subject, the success rate was the percentage of successful trials of the total number of trials. dSF is the difference, in log units, between the SFs presented to the two hands. Error bars indicate SEM.Dashed line represents chance level. B,Average performance of the initial 10 subjects on the 48 low-amplitude sets of gratings. C, Pearson complete cluster analysis of data in A and B (see Results). Group 1 (ST), subjects jd, ov,ys, sm, and rl; group 2 (LT), subjects rc, gt,ms, ah, and sc. The lengths of the branches represent the distances Dij between the subjects: Dij = 1 −Pij, wherePij is the Pearson product moment correlation between subjects i and j.D–G, Psychometric curves of ST group (n = 5) with 24 (D) and 48 (E) sets of gratings, and LT group (n = 5) with 24 (F) and 48 (G) sets of gratings. Results were averaged for each group.
Fig. 3.
Fig. 3.
Motion profiles during single trials.1. Simultaneous opposite, Simultaneous scanning, opposite directions. 2. Simultaneous same, Simultaneous scanning, same direction. 3.Alternating, Scanning with alternating hands.4. No order. lh, Left hand; rh, right hand. Curves were smoothed by a convolution with a triangular of area 1 and a base of ± two samples.
Fig. 4.
Fig. 4.
Distribution of the trial velocities(V) of the left hand during the scanning of the 48 low-amplitude sets of gratings. Each gray levelrepresents a different subject. A, LT subjects and normal scanning. B, ST subjects and normal scanning.C, LT subjects and glove scanning. D, ST subjects and glove scanning.
Fig. 5.
Fig. 5.
Dependency of the temporal frequency (f) of scanning on the SF of the gratings during normal (filled symbols) and glove (open symbols) sessions. Temporal frequencies generated while scanning the high- and low-amplitude sets of gratings with the left hand were averaged for each SF (mean ± SEM across subjects are depicted). A, ST subjects with 24 sets of gratings;B, LT subjects with 24 set; C, ST subjects with 48 set; and D, LT subjects with 48 set. Note the different scale for D.
Fig. 6.
Fig. 6.
Temporal frequencies as a function of trial number during normal and glove sessions. Mean ± SEM (across subjects) of ST subjects (left column) and LT subjects (right column) are depicted for left (lh, filled symbols) and right (rh, open symbols) hands. Bin, Eight trials. For each subject, normal and glove sessions were conducted on different days.
Fig. 7.
Fig. 7.
Performance and confidence. A,B, Success rate (filled symbols) and confidence level (open symbols) as a function of trial number during normal and glove 48 low-amplitude (A) and 24 high-amplitude (B) sessions. Bin, Eight trials; mean ± SEM across subjects are depicted; within each session, curves were smoothed by a convolution with a triangular of area 1 and a base of ± 2 bins.
Fig. 8.
Fig. 8.
Effect of training and guidance on success rates and confidence levels during the scanning of the low-amplitude 48 sets of gratings. Mean ± SEM of success rates (solid lines) and confidence levels (dashed lines) are depicted. Trials were 4 sec long, unless mentioned otherwise.Filled diamonds, LT subjects, testing phase (n = 10 for sessions 1–3; n = 7 for session 4). Open triangles, ST subjects, testing phase (n = 14 for sessions 1–3;n = 10 for session 4). Open diamonds, LT subjects (n = 5), training phase; these subjects performed a normal control session (session 5) and then were trained with guidance in the following sequence of sessions: 6, alternating scanning (alt); 7, low velocity (8 sec trials; lv8); 8, low velocity (lv); 9, alternating scanning with low velocity (alv); and 10, a normal control (ctrl). Filled diamonds, LT subjects (n = 5), training phase; these subjects performed five normal sessions without guidance after completing the testing phase (sessions 5–9; ctrl) and then were trained with guidance for additional five sessions: 10, low velocity (8 sec trials; lv8); 11, low velocity (lv); 12, alternating scanning (alt); 13, alternating scanning with low velocity (8 sec trials; alv8); 14, alternating scanning with low velocity (alv); and 15, a normal control (ctrl). One of the subjects in the latter group (ga) had success rates of <30% in the first guided session, which indicated a possible systematic reversal of his reports during that session. This session was excluded from the data. Exclusion of the entire data of that subject did not significantly change the average curve depicted in the figure.

References

    1. Ahissar E. Temporal-code to rate-code conversion by neuronal phase-locked loops. Neural Comput. 1998;10:597–650. - PubMed
    1. Ahissar E, Gamzu E. Utilization of temporally-encoded versus spatially-encoded information during the performance of a tactile discrimination task. Soc Neurosci Abstr. 1995;21:1018.
    1. Ahissar M, Hochstein S. Task difficulty and the specificity of perceptual learning. Nature. 1997;387:401–406. - PubMed
    1. Ahissar E, Vaadia E. Oscillatory activity of single units in a somatosensory cortex of an awake monkey and their possible role in texture analysis. Proc Natl Acad Sci USA. 1990;87:8935–8939. - PMC - PubMed
    1. Ahissar E, Zacksenhouse M. Temporal and spatial coding in the rat vibrissal system. Prog Brain Res. 2001;130:75–88. - PubMed

Publication types

LinkOut - more resources