. 2001 Sep;46(3):523-34.
doi: 10.1002/mrm.1223.

Mixed echo train acquisition displacement encoding with stimulated echoes: an optimized DENSE method for in vivo functional imaging of the human heart

Affiliations

Mixed echo train acquisition displacement encoding with stimulated echoes: an optimized DENSE method for in vivo functional imaging of the human heart

A H Aletras et al. Magn Reson Med. 2001 Sep.

Abstract

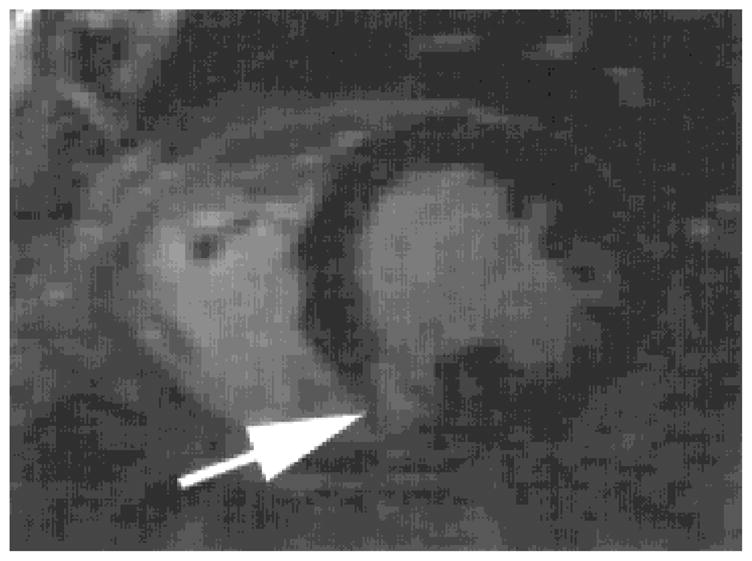
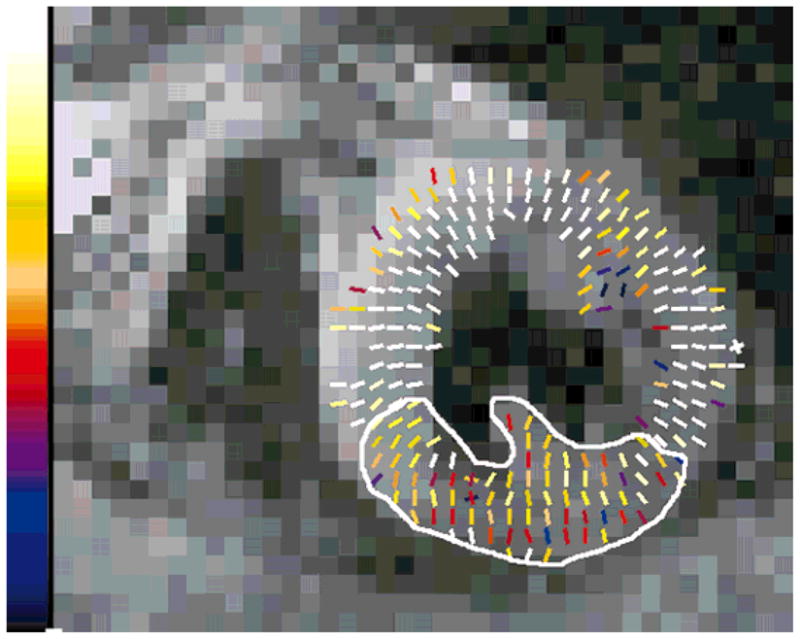
Mixed echo train acquisition displacement encoding with stimulated echoes (meta-DENSE) is a phase-based displacement mapping technique suitable for imaging myocardial function. This method has been optimized for use with patients who have a history of myocardial infarction. The total scan time is 12-14 heartbeats for an in-plane resolution of 2.8 x 2.8 mm2. Myocardial strain is mapped at this resolution with an accuracy of 2% strain in vivo. Compared to standard stimulated echo (STE) methods, both data acquisition speed and resolution are improved with inversion-recovery FID suppression and the meta-DENSE readout scheme. Data processing requires minimal user intervention and provides a rapid quantitative feedback on the MRI scanner for evaluating cardiac function. Published 2001 Wiley-Liss, Inc.


Figures

FIG. 1
FIG. 1
Fast-DENSE image acquired with a segmented EPI readout. Note the signal loss due to intravoxel dephasing in the myocardium (arrow). This magnitude image was acquired with an encoding interval of 100 ms covering the end portion of systole.
FIG. 2
FIG. 2
Schematic representation of the STEAM pulse sequence. Depending on the polarity of the gradient pulse (k2) during TE2, an STE or an STAE will be created, as explained in the Theory section.
FIG. 3
FIG. 3
Schematic representation of a fast spin echo (FSE) readout to rapidly sample the signal generated by a STEAM experiment. This method generates artifacts with DENSE, as described in the text.
FIG. 4
FIG. 4
Schematic representation of our proposed pulse sequence, meta-DENSE, to rapidly sample both parts of the signal generated by a STEAM experiment via 180° refocusing pulses.
FIG. 5
FIG. 5
Schematic representation of the STEAM pulse sequence with FID suppression. The mixing time (TM) is divided in two segments (TM1 and TM2) by an inversion pulse.
FIG. 6
FIG. 6
Magnitude k-space data obtained with in-plane resolution of 2.8 × 2.8 mm2 and encoding strength of 4 mm/π. This encoding strength is not sufficient to shift the complex conjugate of the desired signal outside the sampled window (see the Theory section). The FID is also visible halfway between the two components of the STEAM signal.
FIG. 7
FIG. 7
Magnitude image reconstructed from complex k-space data shown in Fig. 6. Note the severe banding artifact caused by the destructive interference of the three signal components.
FIG. 8
FIG. 8
Magnitude k-space data obtained with in-plane resolution of 2.8 × 2.8 mm2 and encoding strength of 2 mm/π. This encoding strength is sufficient to shift the complex conjugate of the desired signal outside the sampled window (see the Theory section). Some undesired high frequencies are still within the sampled window. The FID is now closer to the edge of the window but it can still be the source of artifacts.
FIG. 9
FIG. 9
Magnitude image reconstructed from complex k-space data shown in Fig. 8. Note that the banding artifact is now caused by the destructive interference of the desired STEAM component and the FID.
FIG. 10
FIG. 10
Magnitude k-space data obtained with in-plane resolution of 2.8 × 2.8 mm2 and encoding strength of 2 mm/π. This encoding strength is sufficient to shift the complex conjugate of the desired signal outside the sampled window (see the Theory section). Also, the FID has been suppressed by the inversion pulse applied during TM.
FIG. 11
FIG. 11
Magnitude image reconstructed from complex k-space data shown in Fig. 10. The banding artifact is minimal.
FIG. 12
FIG. 12
Magnitude k-space data obtained with in-plane resolution of 2.8 × 2.8 mm2 and encoding strength of 2 mm/π from a normal volunteer. The myocardial FID has been suppressed by the inversion pulse applied during TM. However, the FID from adipose tissue is still present due to its different T1.
FIG. 13
FIG. 13
Magnitude image of a normal volunteer reconstructed from complex k-space data shown in Fig. 12. The banding artifact is present in fat but absent in the myocardium, where strain analysis is performed.
FIG. 14
FIG. 14
Strain map depicting myocardial shortening. This map corresponds to the magnitude image shown in Fig. 13. Maximum scale corresponds to 40% strain.
FIG. 15
FIG. 15
Strain map depicting myocardial lengthening. This map corresponds to the magnitude image shown in Fig. 13. Maximum scale corresponds to 40% strain.
FIG. 16
FIG. 16
Strain map depicting myocardial shortening under control conditions. The strain in this map represents the physiological noise floor. Maximum scale corresponds to 20% strain.
FIG. 17
FIG. 17
Strain map depicting myocardial lengthening under control conditions. The strain in this map represents the physiological noise floor. Maximum scale corresponds to 20% strain.
FIG. 18
FIG. 18
Short-axis, contrast-enhanced, T1-weighted diastolic image from a patient with a chronic myocardial infarction in the inferior-septal wall (see arrow).
FIG. 19
FIG. 19
Strain map depicting myocardial shortening. This map corresponds to the systolic function of the slice shown in Fig. 18. Maximum scale corresponds to 25% strain. The akinetic zone is depicted in the circumscribed area.
FIG. 20
FIG. 20
Strain map depicting myocardial lengthening. This map corresponds to the systolic function of the slice shown in Fig. 18. Maximum scale corresponds to 25% strain. The akinetic zone is depicted in the circumscribed area.

References

    1. Callaghan PT. Principles of nuclear magnetic resonance microscopy. Oxford: Clarendon Press; 1991. p. 430.
    1. Aletras AH, Balaban RS, Wen H. Human heart imaging with dual-echo DENSE. Proceedings of the 8th Annual Meeting of ISMRM; Denver. 2000.
    1. Aletras AH, Ding S, Balaban RS, Wen H. DENSE: displacement encoding with stimulated echoes in cardiac functional MRI. J Magn Reson. 1999;137:247–252. - PMC - PubMed
    1. Chenevert TL, Skovoroda AR, O’Donnell M, Emelianov SY. Elasticity reconstructive imaging by means of stimulated echo MRI. Magn Reson Med. 1998;39:482–490. - PubMed
    1. Reese TG, Wedeen VJ, Weisskoff RM. Measuring diffusion in the presence of material strain. J Magn Reson B. 1996;112:253–258. - PubMed

MeSH terms