. 2001 Sep;127(1):240-51.
doi: 10.1104/pp.127.1.240.

N-Acylphosphatidylethanolamine accumulation in potato cells upon energy shortage caused by anoxia or respiratory inhibitors

Affiliations

N-Acylphosphatidylethanolamine accumulation in potato cells upon energy shortage caused by anoxia or respiratory inhibitors

A J Rawyler et al. Plant Physiol. 2001 Sep.

Abstract

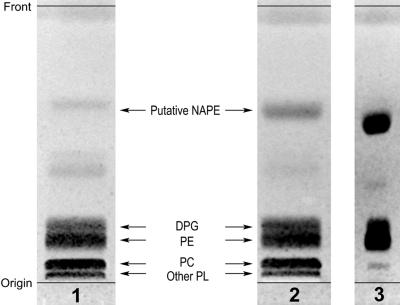
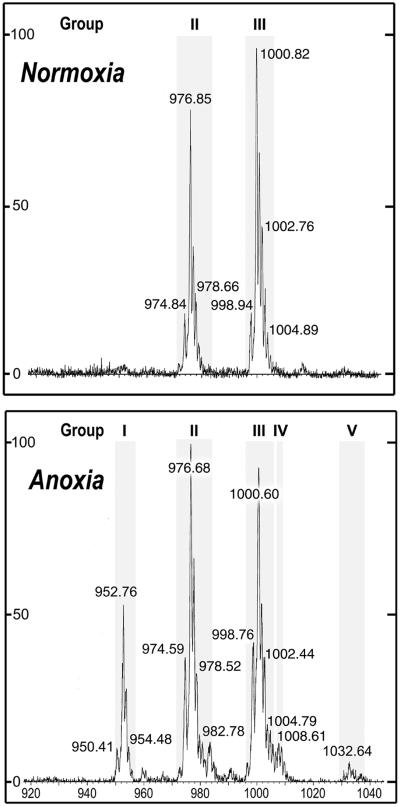
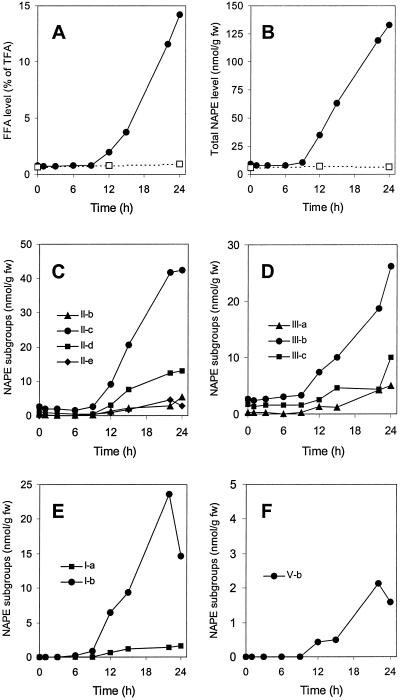
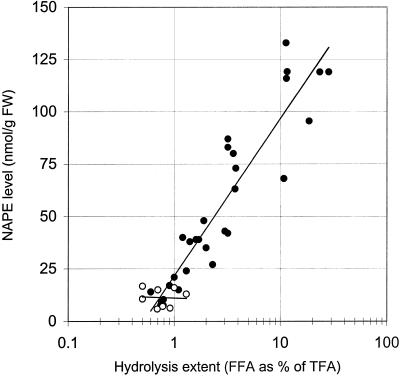
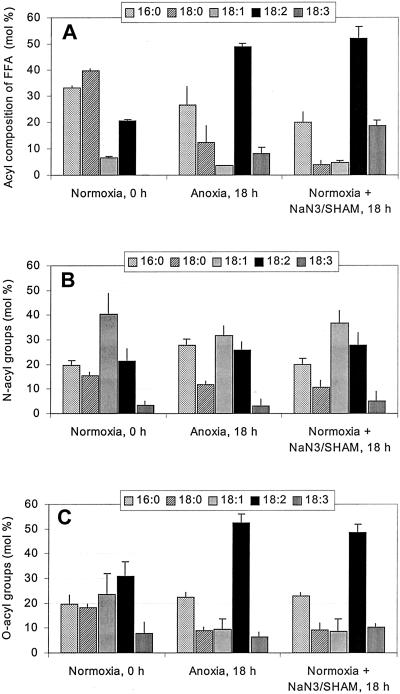
A minor phospholipid was isolated from potato (Solanum tuberosum L. cv Bintje) cells, chromatographically purified, and identified by electrospray ionization mass spectrometry as N-acylphosphatidylethanolamine (NAPE). The NAPE level was low in unstressed cells (13 +/- 4 nmol g fresh weight(-1)). According to acyl chain length, only 16/18/18 species (group II) and 18/18/18 species (group III) were present. NAPE increased up to 13-fold in anoxia-stressed cells, but only when free fatty acids (FFAs) started being released, after about 10 h of treatment. The level of groups II and III was increased by unspecific N-acylation of phosphatidylethanolamine, and new 16/16/18 species (group I) appeared via N-palmitoylation. NAPE also accumulated in aerated cells treated with NaN(3) plus salicylhydroxamate. N-acyl patterns of NAPE were dominated by 18:1, 18:2, and 16:0, but never reflected the FFA composition. Moreover, they did not change greatly after the treatments, in contrast with O-acyl patterns. Anoxia-induced NAPE accumulation is rooted in the metabolic homeostasis failure due to energy deprivation, but not in the absence of O(2), and is part of an oncotic death process. The acyl composition of basal and stress-induced NAPE suggests the existence of spatially distinct FFA and phosphatidylethanolamine pools. It reflects the specificity of NAPE synthase, the acyl composition, localization and availability of substrates, which are intrinsic cell properties, but has no predictive value as to the type of stress imposed. Whether NAPE has a physiological role depends on the cell being still alive and its compartmentation maintained during the stress period.


Figures

Figure 1
Figure 1
One-dimensional TLC of the phospholipid fraction from normoxic and anoxic potato cells. Incubation was for approximately 14 h, at which time the FFA level was <1% under normoxia and 4% under anoxia. The plate was developed in chloroform:methanol:14% aqueous NH3 (80:20:2, v/v), and was visualized by spraying with 0.01% (w/v) primuline in acetone:water (1:1, v/v) followed by viewing under UV light (366 nm). Lane 1, Phospholipids from normoxic cells (50 mg cell fresh weight); lane 2, phospholipids from anoxic cells (51.5 mg cell fresh weight); lane 3, standard NAPE (approximately 30 nmol, higher spot), DPG (approximately 20 nmol, middle spot), and phosphatidylethanolamine (PE; approximately 40 nmol, lower spot). DPG, Diphosphatidylglycerol; PC, phosphatidylcholine; other PL, other phospholipids.
Figure 2
Figure 2
ESI-MS spectra of the putative NAPE class prepared from potato cells incubated either under normoxia or for 23 h under anoxia. The abcissa displays m/z values and the ordinate displays the relative abundance (in percent of the major peak). The ordinate scale was 6-fold higher in the lower portion than in the upper one (note also the difference in background noise). Numbers associated with peaks indicate [M-H] (molecular mass minus proton) values in the negative mode. Shaded areas represent NAPE groups, each of them containing several species with different molecular masses (see Table I for additional details).
Figure 3
Figure 3
Levels of FFAs (A), of total NAPE (B) and of NAPE subgroups (C–F) in potato cells incubated up to 24 h under anoxia (black symbols). Normoxic controls appear as white symbols in A and B, but are omitted in C through F for clarity. In A, the total fatty acid level corresponding to 100% was 21.9 ± 2.1 μmol g fresh weight−1 (n = 8). The level of the various NAPE subgroups was estimated as follows. For each time point, data from ESI-MS measurements (as peak heights) were expressed as percentages of the total height of all NAPE peaks. These values were then converted to absolute amounts, taking the total NAPE amount (in nmol lipid P g fresh weight−1) measured independently as 100%. NAPE subgroups already present at zero time are represented in C (group II) and D (group III), whereas late-appearing NAPEs are depicted in E (group I) and F (group V). For clarity, minor NAPE subgroups (e.g. II-a, II-d, II-f, III-d, and IV-a, accounting for ≤10% of total NAPE) are omitted.
Figure 4
Figure 4
Correlation between the levels of NAPE and of FFA (as a measure of the LAH-induced extent of lipid hydrolysis) in potato cells submitted to anoxia (●) or normoxia (○). Under anoxia, r = 0.930 and the correlation is valid for hydrolysis extents up to 30%, which corresponds to about 7,000 nmol FFA g fresh weight−1. Note the logarithmic scale in abcissa.
Figure 5
Figure 5
Changes in the relative composition (in mol %) of the FFA fraction (A), of N-acyl groups (B), and of O-acyl groups of NAPE (C) isolated from potato cells incubated for 18 h either under anoxia or under normoxia in the presence of 2 mm each NaN3 and SHAM. Data are given as mean ± sd (n = 3). Note that in absolute terms, the sums of all N-acyl and O-acyl groups of NAPE after 18 h of treatment are much higher than those of normoxic controls. The same is true for the FFA fraction (see also Fig. 3).

References

    1. Akoka S, Tellier C, LeRoux C, Marion D. A phosphorous magnetic resonance spectroscopy and a differential calorimetry study of the physical properties of N-acylphosphatidylethanolamines in aqueous dispersions. Chem Phys Lipids. 1988;46:43–50.
    1. Berdyshev EV, Schmid PC, Dong ZG, Schmid HHO. Stress-induced generation of N-acylethanolamines in mouse epidermal JB6-P+ cells. Biochem J. 2000;346:369–374. - PMC - PubMed
    1. Borochov A, Walker MA, Kendall EJ, Pauls KP, McKersie BD. Effect of a freeze-thaw cycle on properties of microsomal membranes from wheat. Plant Phsiol. 1987;84:131–134. - PMC - PubMed
    1. Browse J, Somerville C. Glycerolipid synthesis: biochemistry and regulation. Annu Rev Plant Physiol Plant Mol Biol. 1991;42:467–506.
    1. Chapman KD. Emerging physiological roles for N-acylphosphatidylethanolamine metabolism in plants: signal transduction and membrane protection. Chem Phys Lipids. 2000;108:221–230. - PubMed

Publication types

MeSH terms

Substances

LinkOut - more resources