

Nitrate-induced genes in tomato roots. Array analysis reveals novel genes that may play a role in nitrogen nutrition
- PMID: 11553762
- PMCID: PMC117990
- DOI: 10.1104/pp.127.1.345
Nitrate-induced genes in tomato roots. Array analysis reveals novel genes that may play a role in nitrogen nutrition
Erratum in
- Plant Physiol 2001 Nov;127(3):1323
Abstract
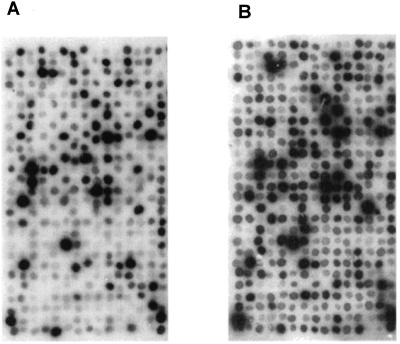
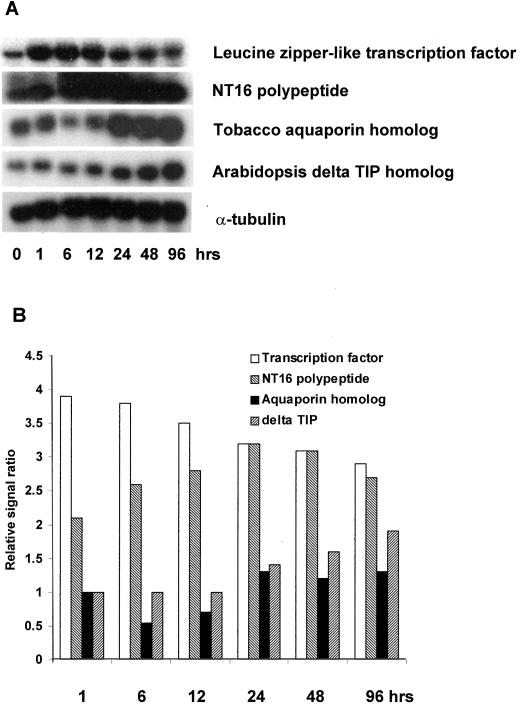
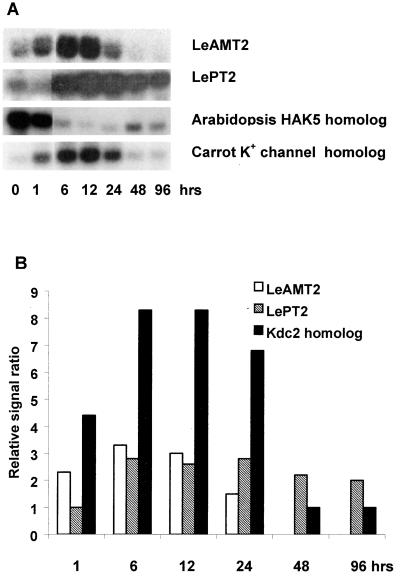
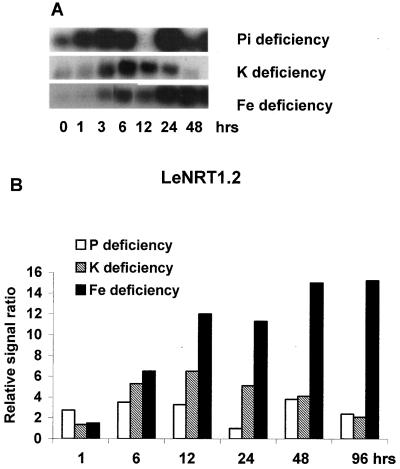
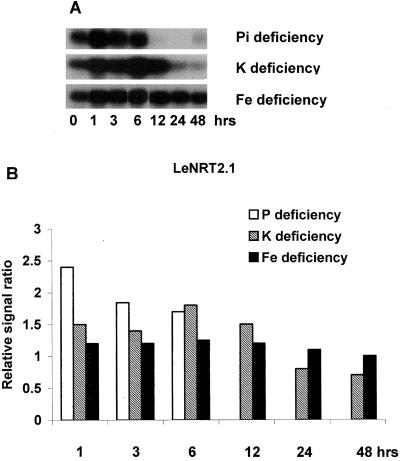
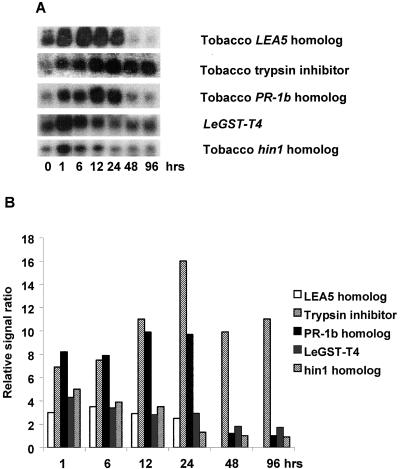
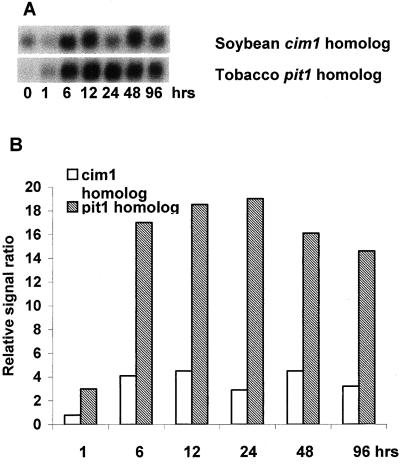
A subtractive tomato (Lycopersicon esculentum) root cDNA library enriched in genes up-regulated by changes in plant mineral status was screened with labeled mRNA from roots of both nitrate-induced and mineral nutrient-deficient (-nitrogen [N], -phosphorus, -potassium [K], -sulfur, -magnesium, -calcium, -iron, -zinc, and -copper) tomato plants. A subset of cDNAs was selected from this library based on mineral nutrient-related changes in expression. Additional cDNAs were selected from a second mineral-deficient tomato root library based on sequence homology to known genes. These selection processes yielded a set of 1,280 mineral nutrition-related cDNAs that were arrayed on nylon membranes for further analysis. These high-density arrays were hybridized with mRNA from tomato plants exposed to nitrate at different time points after N was withheld for 48 h, for plants that were grown on nitrate/ammonium for 5 weeks prior to the withholding of N. One hundred-fifteen genes were found to be up-regulated by nitrate resupply. Among these genes were several previously identified as nitrate responsive, including nitrate transporters, nitrate and nitrite reductase, and metabolic enzymes such as transaldolase, transketolase, malate dehydrogenase, asparagine synthetase, and histidine decarboxylase. We also identified 14 novel nitrate-inducible genes, including: (a) water channels, (b) root phosphate and K(+) transporters, (c) genes potentially involved in transcriptional regulation, (d) stress response genes, and (e) ribosomal protein genes. In addition, both families of nitrate transporters were also found to be inducible by phosphate, K, and iron deficiencies. The identification of these novel nitrate-inducible genes is providing avenues of research that will yield new insights into the molecular basis of plant N nutrition, as well as possible networking between the regulation of N, phosphorus, and K nutrition.
Figures

Similar articles
-
Rapid induction of regulatory and transporter genes in response to phosphorus, potassium, and iron deficiencies in tomato roots. Evidence for cross talk and root/rhizosphere-mediated signals.Plant Physiol. 2002 Nov;130(3):1361-70. doi: 10.1104/pp.008854. Plant Physiol. 2002. PMID: 12428001 Free PMC article.
-
Preferential expression of an ammonium transporter and of two putative nitrate transporters in root hairs of tomato.Proc Natl Acad Sci U S A. 1996 Jul 23;93(15):8139-44. doi: 10.1073/pnas.93.15.8139. Proc Natl Acad Sci U S A. 1996. PMID: 8755617 Free PMC article.
-
LeNRT1.1 Improves Nitrate Uptake in Grafted Tomato Plants under High Nitrogen Demand.Int J Mol Sci. 2018 Dec 7;19(12):3921. doi: 10.3390/ijms19123921. Int J Mol Sci. 2018. PMID: 30544504 Free PMC article.
-
Molecular Regulation of Nitrate Responses in Plants.Int J Mol Sci. 2018 Jul 13;19(7):2039. doi: 10.3390/ijms19072039. Int J Mol Sci. 2018. PMID: 30011829 Free PMC article. Review.
-
Nitrate transport in plants: which gene and which control?J Exp Bot. 2002 Apr;53(370):825-33. doi: 10.1093/jexbot/53.370.825. J Exp Bot. 2002. PMID: 11912225 Review.
Cited by
-
Genomewide bioinformatic analysis negates any specific role for Dof, GATA and Ag/cTCA motifs in nitrate responsive gene expression in Arabidopsis.Physiol Mol Biol Plants. 2009 Apr;15(2):145-50. doi: 10.1007/s12298-009-0016-8. Epub 2009 Jun 28. Physiol Mol Biol Plants. 2009. PMID: 23572923 Free PMC article.
-
Urea transport by nitrogen-regulated tonoplast intrinsic proteins in Arabidopsis.Plant Physiol. 2003 Nov;133(3):1220-8. doi: 10.1104/pp.103.027409. Epub 2003 Oct 23. Plant Physiol. 2003. PMID: 14576283 Free PMC article.
-
Concomitant phytonutrient and transcriptome analysis of mature fruit and leaf tissues of tomato (Solanum lycopersicum L. cv. Oregon Spring) grown using organic and conventional fertilizer.PLoS One. 2020 Jan 13;15(1):e0227429. doi: 10.1371/journal.pone.0227429. eCollection 2020. PLoS One. 2020. PMID: 31931517 Free PMC article.
-
An InDel in the Promoter of Al-ACTIVATED MALATE TRANSPORTER9 Selected during Tomato Domestication Determines Fruit Malate Contents and Aluminum Tolerance.Plant Cell. 2017 Sep;29(9):2249-2268. doi: 10.1105/tpc.17.00211. Epub 2017 Aug 16. Plant Cell. 2017. PMID: 28814642 Free PMC article.
-
Iron deficiency affects nitrogen metabolism in cucumber (Cucumis sativus L.) plants.BMC Plant Biol. 2012 Oct 11;12:189. doi: 10.1186/1471-2229-12-189. BMC Plant Biol. 2012. PMID: 23057967 Free PMC article.
References
-
- Chung H-J, Sehnke PC, Ferl RJ. The 14-3-3 proteins: cellular regulators of plant metabolism. Trends Plant Sci. 1999;4:367–371. - PubMed
-
- Crawford NM, Glass DMA. Molecular and physiological aspect of nitrate uptake in plants. Trends Plant Sci. 1998;3:389–395.
-
- Daniel-Vedele F, Filleur S, Caboche M. Nitrate transport: a key step in nitrate assimilation. Curr Opin Plant Biol. 1998;1:235–239. - PubMed
Publication types
MeSH terms
Substances
LinkOut - more resources
Full Text Sources
Other Literature Sources
