. 2001 Sep 25;98(20):11114-9.
doi: 10.1073/pnas.191369098. Epub 2001 Sep 11.

Opposing cardioprotective actions and parallel hypertrophic effects of delta PKC and epsilon PKC

Affiliations

Opposing cardioprotective actions and parallel hypertrophic effects of delta PKC and epsilon PKC

L Chen et al. Proc Natl Acad Sci U S A. .

Abstract

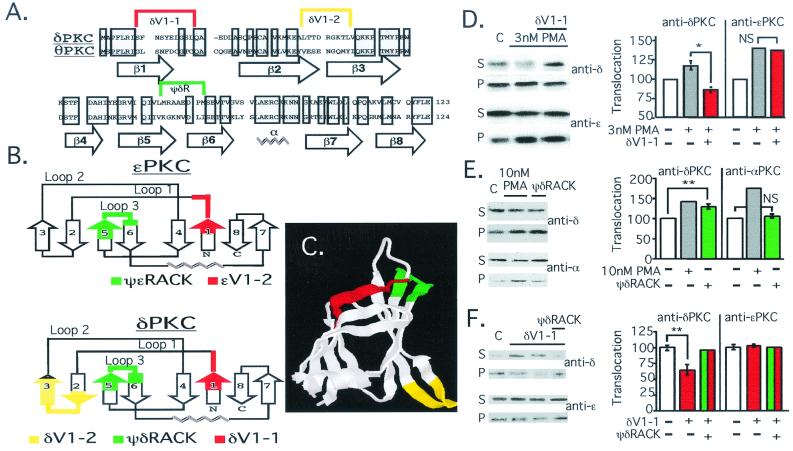
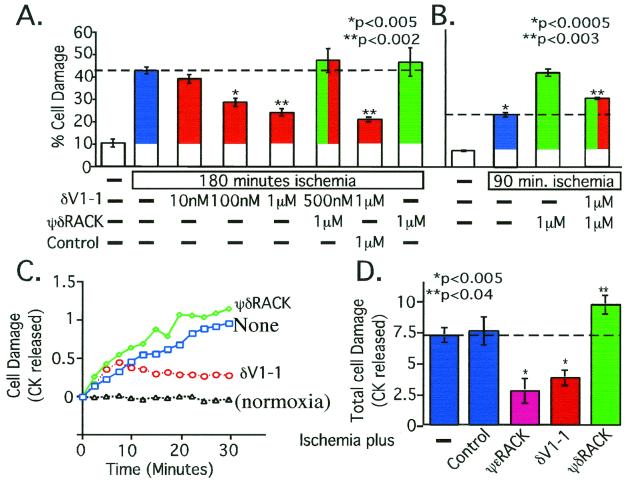
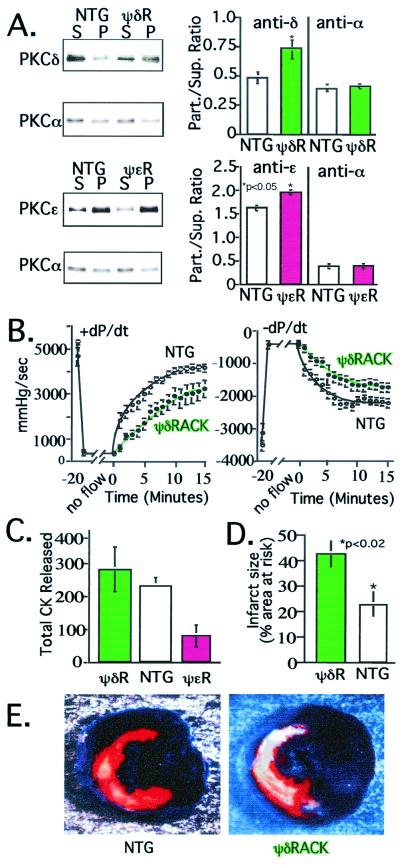
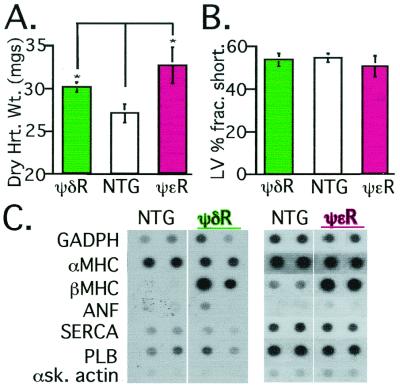
Conflicting roles for protein kinase C (PKC) isozymes in cardiac disease have been reported. Here, deltaPKC-selective activator and inhibitor peptides were designed rationally, based on molecular modeling and structural homology analyses. Together with previously identified activator and inhibitor peptides of epsilonPKC, deltaPKC peptides were used to identify cardiac functions of these isozymes. In isolated cardiomyocytes, perfused hearts, and transgenic mice, deltaPKC and epsilonPKC had opposing actions on protection from ischemia-induced damage. Specifically, activation of epsilonPKC caused cardioprotection whereas activation of deltaPKC increased damage induced by ischemia in vitro and in vivo. In contrast, deltaPKC and epsilonPKC caused identical nonpathological cardiac hypertrophy; activation of either isozyme caused nonpathological hypertrophy of the heart. These results demonstrate that two related PKC isozymes have both parallel and opposing effects in the heart, indicating the danger in the use of therapeutics with nonselective isozyme inhibitors and activators. Moreover, reduction in cardiac damage caused by ischemia by perfusion of selective regulator peptides of PKC through the coronary arteries constitutes a major step toward developing a therapeutic agent for acute cardiac ischemia.


Figures

Figure 1
Figure 1
Rational design of δPKC translocation inhibitor and activator. (A) Alignment of the primary sequence of rat δPKC and mouse θPKC V1 domains (Protein Data Bank accession nos. KIRTCD and NP_032885, respectively); shadowed boxes indicate identity. Location of β-strands and the α-helix based on δV1 structure analysis (26) are indicated below the sequence; sequences most different between the two isozymes are marked above with a color bracket. (B) The secondary structure of δV1 (26) (Lower) and a modeled secondary structure of ɛV1 (G.C., D.M.-R., and L.B., unpublished work; Upper) are schematically depicted, according to ref. . Numbering of β-strands in δV1 and ɛV1 domains are marked as in A for δV1. The sequence corresponding to δV1–1, amino acids 8–17 [SFNSYELGSL], δV1–2, amino acids 35–45 [ALTTDRGKTLV], and ψδRACK, amino acids 74–81 [MRAAEDPM], are marked as in A, in red, yellow, and green, respectively. The sequence corresponding to the ɛPKC-selective inhibitor peptide, ɛV1–2, amino acids 14–21 [EAVSLKPT] (12), and activator peptide, ψɛRACK, amino acids 85–92 [HDAPIGYD] (13), are marked in red and green, respectively (Upper). (C) Crystal structure of the δV1 domain (Protein Data Bank ID no. 1BDY; ref. 26) is depicted with areas marked in colors corresponding to those in A and B. (D) Western blot analysis of cytosolic and particulate fractions from adult rat cardiac myocytes was carried out as described (13) to demonstrate isozyme-selective effects on δPKC translocation. Cells were treated with PMA in the presence and absence of δV1–1. (Left) Autoradiogram of soluble (S) and particulate (P) fractions probed with anti-δPKC (Upper) and the same blot probed with anti-ɛPKC antibodies (Lower). (Right) Mean ± SEM of data from three experiments; translocation is expressed as the amount of each isozyme in the particulate fraction over the amount of that isozyme in nontreated cells. *, P < 0.05; NS, not significant; n = 3. (E) Same as in D, except cells were treated with PMA or ψδRACK and translocation of δPKC and αPKC is shown. **, P < 0.01. (F) Same as D, except cells were treated with δV1–1 in the presence and absence of ψδRACK. **, P < 0.01.
Figure 2
Figure 2
Ischemic damage is due, in part, to δPKC activation. (A) Isolated rat cardiac myocytes from adult male rats (13, 18) were pretreated with the δPKC-selective inhibitor peptide, δV1–1, and/or activator peptide, ψδRACK (green), before simulated ischemia. Control is βPKC-selective activator (10). Statistical analysis compares all data to those obtained from cells treated with no peptide (blue). (B) As in A, but ischemic period was shortened to illustrate an additive effect between ψδRACK and ischemia in inducing damage. Statistical analysis compares data from cells treated with no peptide (blue; *) and with ψδRACK in the presence of δV1–1 (red plus green; **) to cells treated with ψδRACK alone (green). (C) Whole hearts from adult male rats were perfused with the δPKC-selective inhibitor peptide δV1–1 or activator peptide ψδRACK before global ischemia followed by reperfusion using the Langendorff preparation (13, 18). Shown is average levels over time. (D) Total CK released over the 30-min reperfusion (13, 18) are shown and include the effect of infusion of the ɛPKC-selective activator, ψɛRACK (magenta). Controls (second blue bar) include peptides coupled to Tat-carrier peptide with a scrambled sequence or a nonrelevant sequence and Tat-carrier peptide alone. All measurements were carried out in triplicate, using 3–4 animals per condition.
Figure 3
Figure 3
ψδRACK transgenic mice exhibit increased damage by cardiac ischemia. (A) Western blot and analysis of PKC distribution in cytosolic and particulate fractions from ψδRACK mice (ψδR, Upper; green bars) and ψɛRACK transgenic mice (ψɛR, Lower; magenta bars) and their nontransgenic littermates (NTG; white bars) was carried out as described (13) to demonstrate isozyme-selective translocation of PKC. (Right) Histogram shows mean ± SEM of data from eight mice for each group. (B) Hemodynamic parameters were monitored in hearts from transgenic ψδRACK transgenic mice (green symbols) and their nontransgenic littermates (white symbols) after global ischemia. Left ventricular pressure and real time derivative was monitored via a catheter placed in the ventricular apex (13). Hemodynamic measurements were recorded every 20 sec throughout reperfusion. Data are mean ± SEM of 12 ψδRACK and 11 nontransgenic mice. (C) Fractions of perfusate from mice used in B were collected throughout reperfusion and CK activity was assessed to determine cell damage. For comparison, data from ψɛRACK mice are also included. Data are mean ± SEM of six ψδRACK mice (green bar), six nontransgenic mice (white bar), and seven ψɛRACK mice (magenta bar). (D) Infarct size as a percent of the region of risk in mice with sustained δPKC activation (ψδRACK mice; green bar) and nontransgenic littermates (white bar) was determined in vivo after coronary occlusion followed by 24 h of reperfusion as described (mean ± SEM) (22, 23). The area at risk was not significantly different between the nontransgenic and ψδRACK mice (36 ± 3% and 41 ± 5% of left ventricle for nontransgenic and ψδRACK mice, respectively). Data are from eight 30- to 34-week-old transgenic females and five nontransgenic female littermates. So far only three males were available for analysis and therefore they are not included in the analysis; in all of the other studies, equal numbers of male and female transgenic and nontransgenic mice were used. (E) Example of infarcts in a ψδRACK transgenic mouse (Right) and a littermate (Left) subjected to coronary occlusion and 24 h of reperfusion in vivo. The portion of the left ventricle supplied by the occluded coronary artery (region of risk) was identified by the absence of Phthalo blue dye, which was perfused only through the nonoccluded vascular bed (22, 23). The infarcted area was identified by perfusion with 2,3,5-triphenyltetrazolium chloride, which stains viable tissue bright red, whereas infarcted tissue is light yellow (22, 23).
Figure 4
Figure 4
ψδRACK transgenic mice exhibit hypertrophy similar to ψɛRACK mice. (A) Dry heart weights of nontransgenic and ψδRACK-expressing transgenic mice were measured as in ref. , demonstrating hypertrophy in hearts of ψδRACK and ψɛRACK mice. Data are mean ± SEM from 10 ψδRACK mice (green bar), five nontransgenic mice (white bar), and three ψɛRACK mice (magenta bar). (B) Left ventricular fractional shortening was measured in the nontransgenic and transgenic mice as described (13, 21). Data are mean ± SEM obtained from nine ψδRACK mice (green bar), 10 nontransgenic mice (white bar), and four ψɛRACK mice (magenta bar). (C) Dot blot analysis of mRNA from hearts of transgenic and nontransgenic mice showing increased expression of βMHC, a marker for hypertrophy (33). GADPH, glyceraldehyde-3-phosphate dehydrogenase; αMHC, α-myosin heavy chain; βMHC, β-myosin heavy chain; ANF, atrial natriuritic factor; SERCA, sarcoplasmic reticular ATPase; PLB, phospholamban; αSK actin, α skeletal actin.

References

    1. Brooks G, Hearse D J. Circ Res. 1996;79:627–630. - PubMed
    1. Gu X, Bishop S P. Circ Res. 1994;75:926–931. - PubMed
    1. Bowling N, Walsh R A, Song G, Estridge T, Sandusky G E, Fouts R L, Mintze K, Pickard T, Roden R, Bristow M R, et al. Circulation. 1999;99:384–391. - PubMed
    1. Jalili T, Takeishi Y, Song G, Ball N A, Howles G, Walsh R A. Am J Physiol. 1999;277:H2298–H2304. - PubMed
    1. Mochly-Rosen D, Henrich C J, Cheever L, Khaner H, Simpson P C. Mol Biol Cell. 1990;1:693–706. - PMC - PubMed

Publication types

MeSH terms

LinkOut - more resources