. 2001 Sep;26(7):925-33.
doi: 10.1093/chemse/26.7.925.

Positional cloning of the mouse saccharin preference (Sac) locus

Affiliations

Positional cloning of the mouse saccharin preference (Sac) locus

A A Bachmanov et al. Chem Senses. 2001 Sep.

Abstract

Differences in sweetener intake among inbred strains of mice are partially determined by allelic variation of the saccharin preference (Sac) locus. Genetic and physical mapping limited a critical genomic interval containing Sac to a 194 kb DNA fragment. Sequencing and annotation of this region identified a gene (Tas1r3) encoding the third member of the T1R family of putative taste receptors, T1R3. Introgression by serial backcrossing of the 194 kb chromosomal fragment containing the Tas1r3 allele from the high-sweetener-preferring C57BL/6ByJ strain onto the genetic background of the low-sweetener-preferring 129P3/J strain rescued its low-sweetener-preference phenotype. Polymorphisms of Tas1r3 that are likely to have functional significance were identified using analysis of genomic sequences and sweetener-preference phenotypes of genealogically distant mouse strains. Tas1r3 has two common haplotypes, consisting of six single nucleotide polymorphisms: one haplotype was found in mouse strains with elevated sweetener preference and the other in strains relatively indifferent to sweeteners. This study provides compelling evidence that Tas1r3 is equivalent to the Sac locus and that the T1R3 receptor responds to sweeteners.


Figures
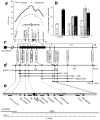
Fig. 1
Fig. 1
Genetic and physical maps of the Sac region a, Interval mapping of sucrose and saccharin consumption to distal chromosome 4 using MAPMAKER software (Lander et al., 1987). Distances between markers were estimated based on data from the B6 × 129 F2 intercross (n = 629). Curves trace the LOD scores calculated using an unconstrained model [LOD threshold for significant linkage 4.3, 2 d.f. (Lander and Kruglyak, 1995)]. The horizontal lines show the 2-LOD drop confidence intervals for saccharin (dotted line, 5.3 cM) and sucrose (solid line, 4.5 cM); black triangles indicate the respective LOD score peaks (LOD 20.3 for saccharin and 23.3 for sucrose). This locus explained 18.6% and 16.2% of the variance in saccharin and sucrose intakes respectively. Analyses of LOD scores under dominant and additive models (not shown) demonstrated that the B6 allele is dominant over the 129 allele. Analysis of preference scores showed similar results (not shown). b, Average daily 17 mM saccharin consumption by mice from parental 129 and B6 strains (left), F2 hybrids (center), and N6, N7, N4F4 and N3F5 segregating partially congenic 129.B6-Sac mice (right) in 96-hr two-bottle tests with water (means ± SE). Genotypes of the F2 and congenic mice for Tas1r3 and their numbers are indicated on the bars. Each group had approximately equal numbers of males and females. Differences between parental strains and among the F2 and congenic genotypes were significant (F > 39.5, p < 0.000001, ANOVA). Females consumed more saccharin than males (F > 26.5, p < 0.000005), and the differences among genotypes were more pronounced in females than in males (interaction gender × strain or genotype, F > 6.4, p < 0.02). However, the main effect of genotype was the same for females and males: F2 and congenic B6 homozygotes and heterozygotes for Tas1r3 did not differ from each other, and had higher saccharin intakes than did 129 homozygotes (p < 0.000001, planned comparisons). Intakes of 120 mM sucrose were 14.2 ± 0.6 ml/30 g BW for the F2 mice homozygous for B6 allele of Tas1r3 (n = 170), 13.8 ± 0.5 ml/30 g BW for the F2 heterozygotes (n = 299) and 7.4 ± 0.4 ml/30 g BW for the F2 mice homozygous for 129 allele of Sac (n = 152); results of statistical analyses were similar to those for saccharin. Haplotype of the donor fragment in the Sac-congenic mice is depicted in panel c. c, Linkage map of the Sac-containing region. Distances between markers were obtained from the B6 × 129 F2 intercross (see panel a). A black box depicts the donor fragment of the 129.B6-Sac partially congenic mice whose saccharin intakes are shown on panel b, right. Location and size of the donor fragment were determined based on the presence of B6 alleles of polymorphic markers in mice from the N4, N6, N7, N4F4 and N3F5 generations. The donor fragment ends proximally between 280G12-T7 and 49O2-T7, and distally between 350D2-T7 and D4Mon1. d, BAC contig and physical map of distal chromosome 4 in the Sac region. BAC sizes (kb) are shown in parentheses. Dots indicate presence of markers within BACs detected by hybridization and confirmed by PCR and, in some cases, by sequencing. 139J18-SP6 and D4Mon1 were found within the 118E21 sequence, but were not used for BAC screening (D4Mon1 was used for genotyping F2 and congenic mice). In this region, linkage distance of 1 cM corresponds to ~0.25 Mb of physical distance instead of typical 2 Mb, and therefore the frequency of recombinations is ~8 times higher than the average throughout the genome. e, Genes within the Sac-containing interval flanked by 280G12-T7 and D4Mon1. The full sequence of this region is assembled from BAC 118E21 and from Mus musculus cyclin ania-6b gene (GenBank accession no. AF185591). Filled areas indicate predicted genes. Arrows indicate the predicted direction of transcription.
Fig. 2
Fig. 2
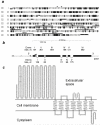
Structure of the Tas1r3 gene. a, Protein alignment of the novel T1R3 and the previously described T1R1 [Tas1r1 or Gpr70; GenBank accession no. AF301161 (Li et al., 2001b)] mouse genes. Identical amino acids are shaded in black; conservative amino acid substitutions are shaded in gray. The protein sequences of T1R3 and T1R1 were deduced from cDNA sequences of the B6 strain. * denotes missense polymorphisms in T1R3. Roman numerals with solid black bars underneath indicate the transmembrane domains. b, Structure of the Tas1r3 gene based on comparison between genomic DNA and cDNA sequences from mouse tongue epithelium. The six coding exons are shown as black boxes. Exon and intron sizes are given in nucleotide base pairs (sizes of exons I and VI are partial, excluding untranslated regions). Asterisks indicate SNPs defining haplotypes of high-sweetener preferring strains (B6-like) and low-sweetener preferring strains (129-like; see Fig 3). The B6-like/129-like haplotypes are as follows (the haplotype nucleotides are numbered with the A in the ATG start codon as nucleotide 1): T/A at nt −2383, A/G at nt −183, A/G at nt 135 (exon I, silent at amino acid position 45), A/G at nt 163 (exon I, missense T55A), T/C at nt 179 (exon I, missense I60T), and T/C at nt 651, (intron II). c, Conformation of the predicted T1R3 protein. The missense mutations (Thr55Ala and Ile60Thr) are denoted with *.
Fig. 3
Fig. 3
Relationship between Tas1r3 haplotype and sweetener preference. Saccharin (a) and sucrose (b) preferences by mice from inbred strains with two different haplotypes of the Tas1r3 gene (see Figure 2b). The strains with the B6-like haplotype of Tas1r3 strongly preferred saccharin (81 ± 4%) and sucrose (86 ± 5%), whereas strains with the 129-like haplotype were indifferent to these solutions (57 ± 1% and 57 ± 3% respectively, ps < 0.0003, t-tests). The SEA/GnJ strain had lower sweetener preference compared with other strains with the B6-like haplotype. A mutation within the bone morphogenetic 5 protein in the SEA/GnJ strain (Kingsley et al., 1992) may cause disturbance in calcium metabolism and reduce sweetener preference (Tordoff and Rabusa, 1998). The complete strain name is shown if identical substrains were used for genotyping and phenotyping; the strain name is truncated if the substrain genotyped differed from the substrain phenotyped.

References

    1. Adler E, Hoon MA, Mueller KL, Chandrashekar J, Ryba NJ, Zuker CS. A novel family of mammalian taste receptors. Cell. 2000;100:693–702. - PubMed
    1. Antoch MP, Song EJ, Chang AM, Vitaterna MH, Zhao Y, Wilsbacher LD, Sangoram AM, King DP, Pinto LH, Takahashi JS. Functional identification of the mouse circadian Clock gene by transgenic BAC rescue. Cell. 1997;89:655–67. - PMC - PubMed
    1. Bachmanov AA, Reed DR, Ninomiya Y, Inoue M, Tordoff MG, Price RA, Beauchamp GK. Genetic locus on mouse chromosome 4 influencing taste responses to sweeteners (Abstract) Chemical Senses. 1997a;22:642.
    1. Bachmanov AA, Reed DR, Ninomiya Y, Inoue M, Tordoff MG, Price RA, Beauchamp GK. Sucrose consumption in mice: major influence of two genetic loci affecting peripheral sensory responses. Mammalian Genome. 1997b;8:545–548. - PMC - PubMed
    1. Bachmanov AA, Tordoff MG, Beauchamp GK. Ethanol consumption and taste preferences in C57BL/6ByJ and 129/J mice. Alcohol Clin Exp Res. 1996;20:201–6. - PMC - PubMed

Publication types

MeSH terms

Associated data