Review
. 2001 Sep 15;29(18):3705-27.
doi: 10.1093/nar/29.18.3705.

Structure and function of type II restriction endonucleases

Affiliations
Review

Structure and function of type II restriction endonucleases

A Pingoud et al. Nucleic Acids Res. .

Abstract

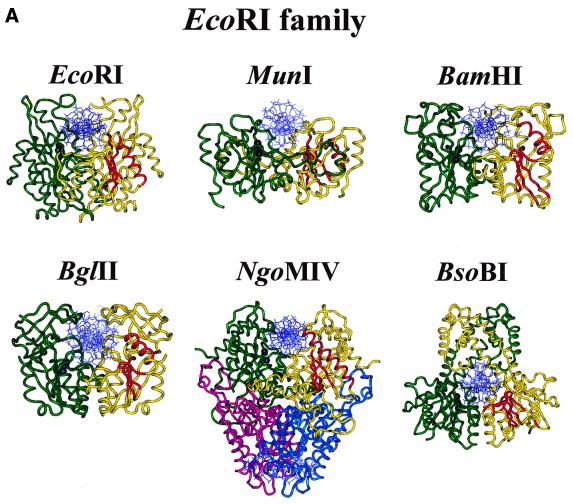
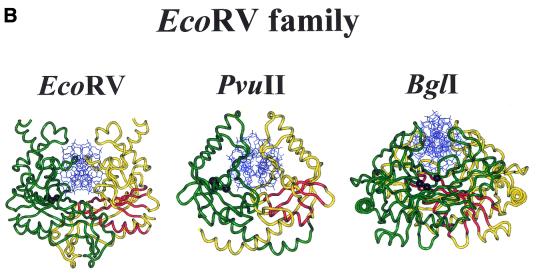
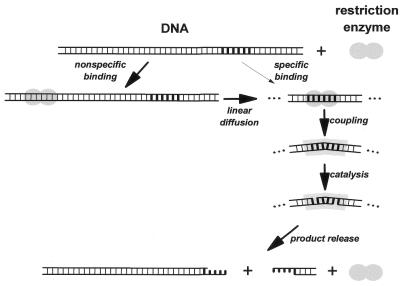
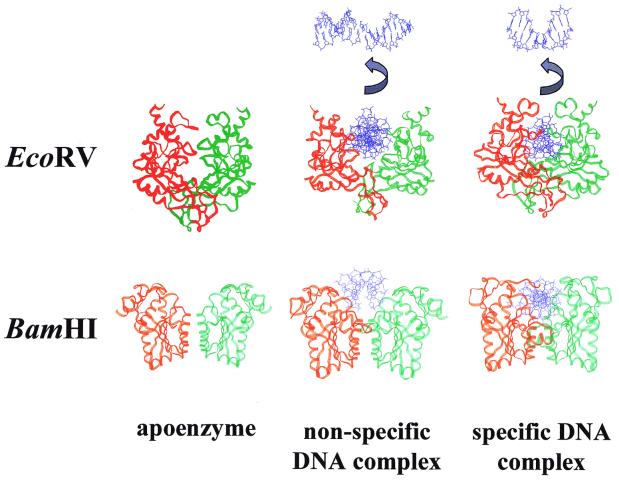
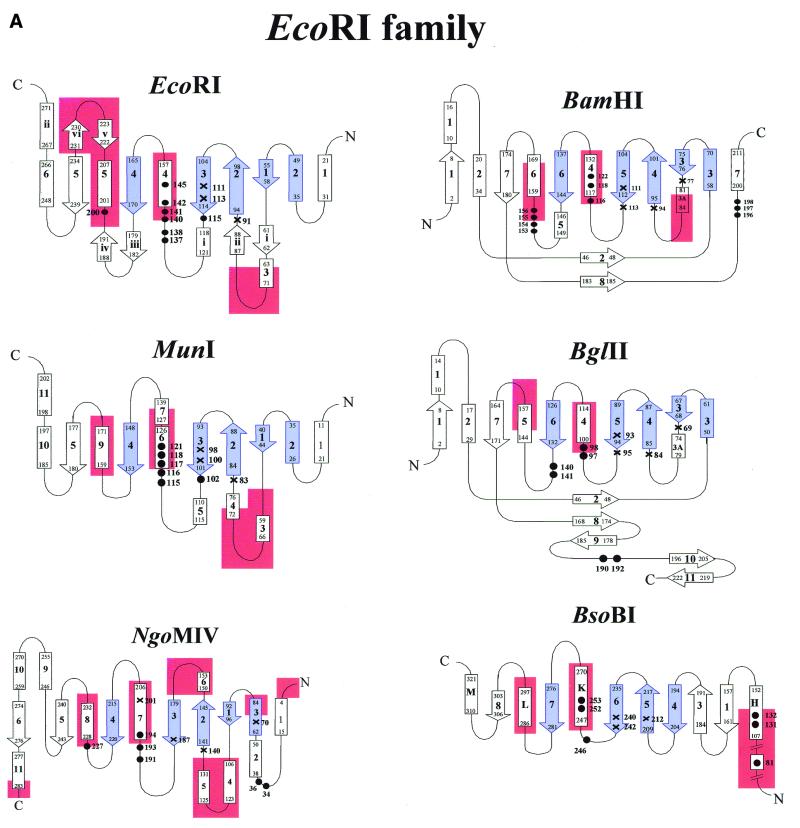
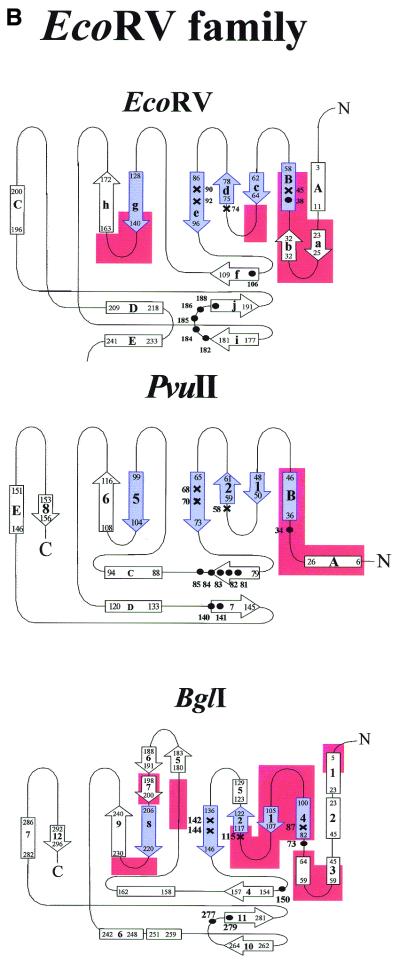
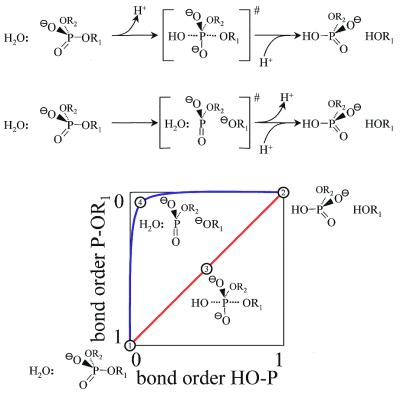
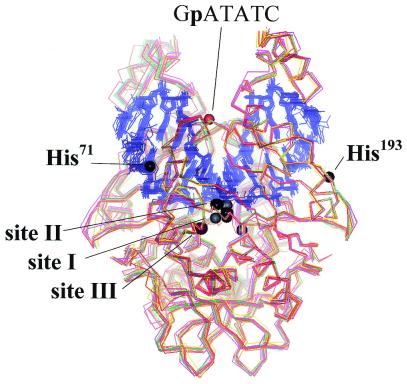
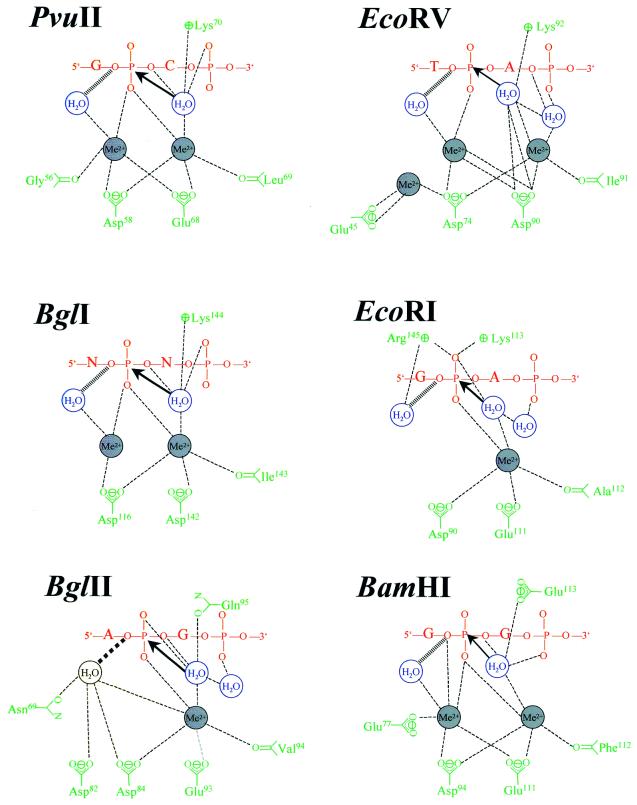
More than 3000 type II restriction endonucleases have been discovered. They recognize short, usually palindromic, sequences of 4-8 bp and, in the presence of Mg(2+), cleave the DNA within or in close proximity to the recognition sequence. The orthodox type II enzymes are homodimers which recognize palindromic sites. Depending on particular features subtypes are classified. All structures of restriction enzymes show a common structural core comprising four beta-strands and one alpha-helix. Furthermore, two families of enzymes can be distinguished which are structurally very similar (EcoRI-like enzymes and EcoRV-like enzymes). Like other DNA binding proteins, restriction enzymes are capable of non-specific DNA binding, which is the prerequisite for efficient target site location by facilitated diffusion. Non-specific binding usually does not involve interactions with the bases but only with the DNA backbone. In contrast, specific binding is characterized by an intimate interplay between direct (interaction with the bases) and indirect (interaction with the backbone) readout. Typically approximately 15-20 hydrogen bonds are formed between a dimeric restriction enzyme and the bases of the recognition sequence, in addition to numerous van der Waals contacts to the bases and hydrogen bonds to the backbone, which may also be water mediated. The recognition process triggers large conformational changes of the enzyme and the DNA, which lead to the activation of the catalytic centers. In many restriction enzymes the catalytic centers, one in each subunit, are represented by the PD. D/EXK motif, in which the two carboxylates are responsible for Mg(2+) binding, the essential cofactor for the great majority of enzymes. The precise mechanism of cleavage has not yet been established for any enzyme, the main uncertainty concerns the number of Mg(2+) ions directly involved in cleavage. Cleavage in the two strands usually occurs in a concerted fashion and leads to inversion of configuration at the phosphorus. The products of the reaction are DNA fragments with a 3'-OH and a 5'-phosphate.


Figures

Figure 1
Figure 1
Crystal structures of specific restriction endonuclease–DNA complexes. The two subunits of the homodimeric restriction endonucleases are shown in yellow and green (for the homotetrameric NgoMIV the individual subunits are colored yellow and green, purple and cyan), the DNA is shown in blue. In one subunit the four strictly conserved β-strands (EcoRI: β1, β2, β3 and β4; EcoRV: βc, βd, βe and βg) and one α-helix (EcoRI: α2; EcoRV: αB) of the common core are shown in red, in the other subunit the Cα-positions of the three essential amino acid residues of the PD . . . D/EXK motif are depicted as black spheres. For PDB codes see Table 2.
Figure 1
Figure 1
Crystal structures of specific restriction endonuclease–DNA complexes. The two subunits of the homodimeric restriction endonucleases are shown in yellow and green (for the homotetrameric NgoMIV the individual subunits are colored yellow and green, purple and cyan), the DNA is shown in blue. In one subunit the four strictly conserved β-strands (EcoRI: β1, β2, β3 and β4; EcoRV: βc, βd, βe and βg) and one α-helix (EcoRI: α2; EcoRV: αB) of the common core are shown in red, in the other subunit the Cα-positions of the three essential amino acid residues of the PD . . . D/EXK motif are depicted as black spheres. For PDB codes see Table 2.
Figure 2
Figure 2
Schematic illustration of the steps involved in DNA binding and cleavage by type II restriction endonucleases.
Figure 3
Figure 3
Comparison of the crystal structures of the free enzyme, the non-specific and the specific DNA complex for the restriction endonucleases EcoRV and BamHI. The two subunits are shown in red and green, the DNA in blue. For EcoRV, the DNA is also shown viewed along the dyad axis to demonstrate the absence of bending in the non-specific complex and the presence of bending in the specific complex. PDB code numbers are: EcoRV (1RVE), non-specific complex (2RVE), specific complex (4RVE); BamHI (1BAM), non-specific complex (1ESG), specific complex (1BHM). It is apparent that large conformational changes take place when the free enzymes bind to non-specific DNA and to specific DNA, respectively. In the case of EcoRV, these conformational changes include the DNA which is bent by 50° in the specific complex. It is noteworthy that in the specific complex the DNA is almost completely encircled which gives the specific complex a more compact appearance compared to the non-specific one.
Figure 4
Figure 4
(Opposite and above) The topologies of selected type II restriction endonucleases to illustrate similarities of architecture and to identify functionally important regions. Shown are the secondary structure diagrams for those restriction enzymes for which crystal structures of specific enzyme–DNA complexes have been determined (see Fig. 1). The elements comprising the common core are indicated in blue. Catalytically important amino acid residues are marked with a cross and those involved in contacts to the bases are marked with black filled circles. Regions involved in dimerization contacts are colored red. The numbering scheme is that of the respective crystallographers. The large helical N-terminal domain of BsoBI is not included in the diagram.
Figure 4
Figure 4
(Opposite and above) The topologies of selected type II restriction endonucleases to illustrate similarities of architecture and to identify functionally important regions. Shown are the secondary structure diagrams for those restriction enzymes for which crystal structures of specific enzyme–DNA complexes have been determined (see Fig. 1). The elements comprising the common core are indicated in blue. Catalytically important amino acid residues are marked with a cross and those involved in contacts to the bases are marked with black filled circles. Regions involved in dimerization contacts are colored red. The numbering scheme is that of the respective crystallographers. The large helical N-terminal domain of BsoBI is not included in the diagram.
Figure 5
Figure 5
Principle mechanisms of phosphoryl transfer reactions. On top the mechanism of phosphodiester bond cleavage following an associative or a dissociative route is shown. These mechanisms differ in the amount of bond formation and bond breakage in the transition state. This is illustrated in the graph on the bottom in which the bond order of the bond to be cleaved is plotted against the bond order of the bond being formed. For an associative mechanism (red line) both bond orders change proportionally, whereas for a dissociative mechanism (blue line), the bond to the leaving group is largely cleaved while the bond to the attacking nucleophile is not yet formed. 1, Enzyme–substrate commplex; 2, enzyme–product complex; 3, transition state of the associative mechanism; 4, transition state of the dissociative mechanism.
Figure 6
Figure 6
Superposition of all solved structures of EcoRV and metal-ion binding site in EcoRV. The figure shows how similar these structures are although they are determined from crystals in different crystal lattices, using different substrates and metal ions. In addition all divalent metal ion binding sites as seen in different co-crystal structures and as deduced from biochemical experiments are indicated. The metal-ion binding sites near the active site are shown for both subunits, the additional sites (near His71, near His193 and near the GpATATC phosphate) are shown only for one subunit.
Figure 7
Figure 7
Comparison of the active sites of restriction enzymes as deduced from co-crystal structures of specific protein–DNA substrate complexes obtained in the presence of divalent metal ions (based on 159). In EcoRV the sites formed by Asp90 and Ile91, Asp74 and Asp90 as well as Glu45 and Asp74 are numbered I, II and III, respectively, in this review. The same numbering scheme is applied to all other enzymes.

References

    1. Roberts R.J. and Halford,S.E. (1993) Type II restriction endonucleases. In Linn,S.M., Lloyd,R.S. and Roberts,R.J. (eds), Nucleases. Cold Spring Harbor Laboratory Press, Cold Spring Harbor, New York, NY, pp. 35–88.
    1. Raleigh E.A. and Brooks,J.E. (1998) In De Bruijn,F.J., Lupski,J.R. and Weinstock,G.M. (eds), Bacterial Genomes. Chapman & Hall, New York, pp. 78–92.
    1. Arber W. (1979) Promotion and limitation of genetic exchange. Science, 205, 361–365. - PubMed
    1. Heitman J. (1993) On the origins, structures and functions of restriction-modification enzymes. In Setlow,J.K. (ed.), Genetic Engineering. Plenum Press, New York, Vol. 15, pp. 57–108. - PubMed
    1. McKane M. and Milkman,R. (1995) Transduction, restriction and recombination patterns in Escherichia coli. Genetics, 139, 35–43. - PMC - PubMed

Publication types

MeSH terms

Substances