

MR volumetry of the entorhinal, perirhinal, and temporopolar cortices in drug-refractory temporal lobe epilepsy
- PMID: 11559496
- PMCID: PMC7974580
MR volumetry of the entorhinal, perirhinal, and temporopolar cortices in drug-refractory temporal lobe epilepsy
Abstract
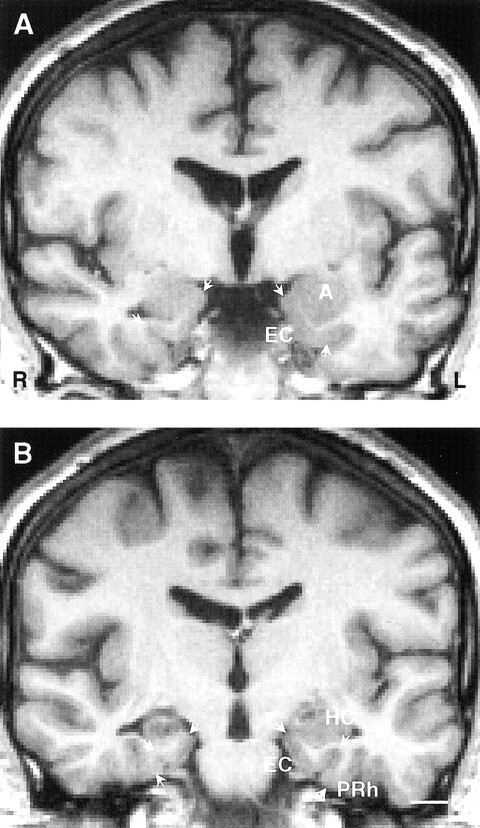
Background and purpose: The occurrence of damage in the entorhinal, perirhinal, and temporopolar cortices in unilateral drug-refractory temporal lobe epilepsy (TLE) was investigated with quantitative MR imaging.
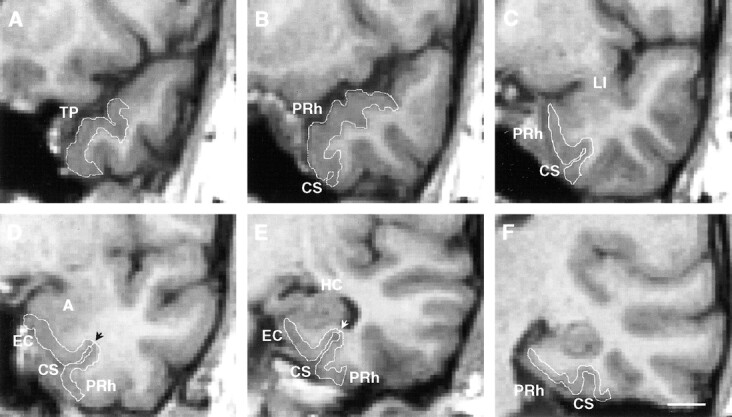
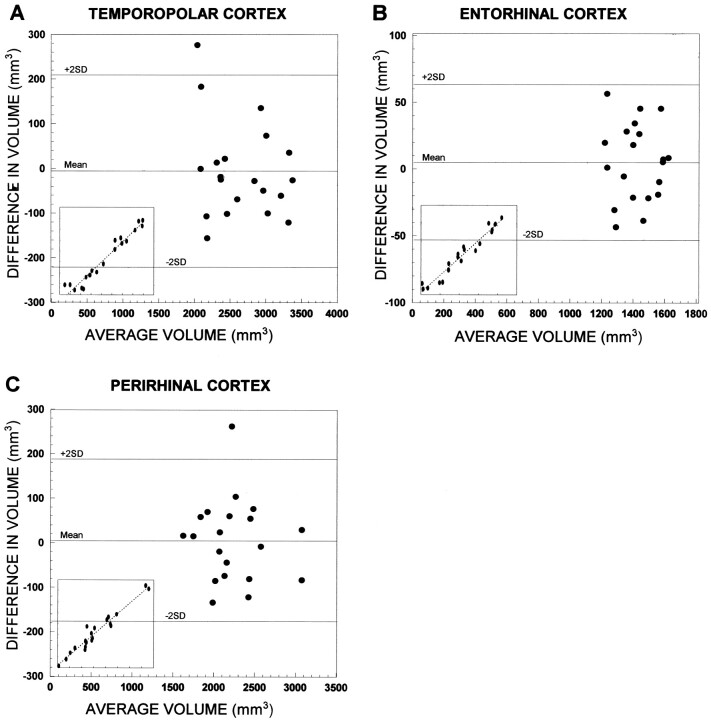
Methods: Volumes of the entorhinal, perirhinal, and temporopolar cortices were measured in 27 patients with unilateral drug-refractory TLE, 10 patients with extratemporal partial epilepsy, and 20 healthy control subjects. All patients with TLE were evaluated for epilepsy surgery and underwent operations.
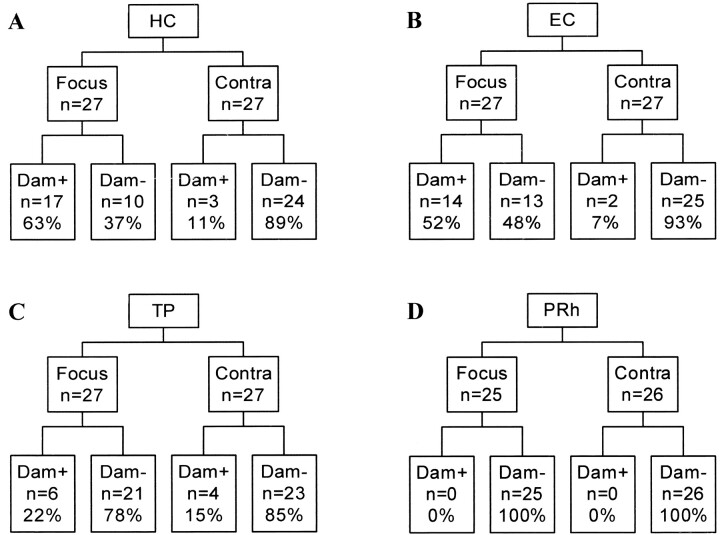
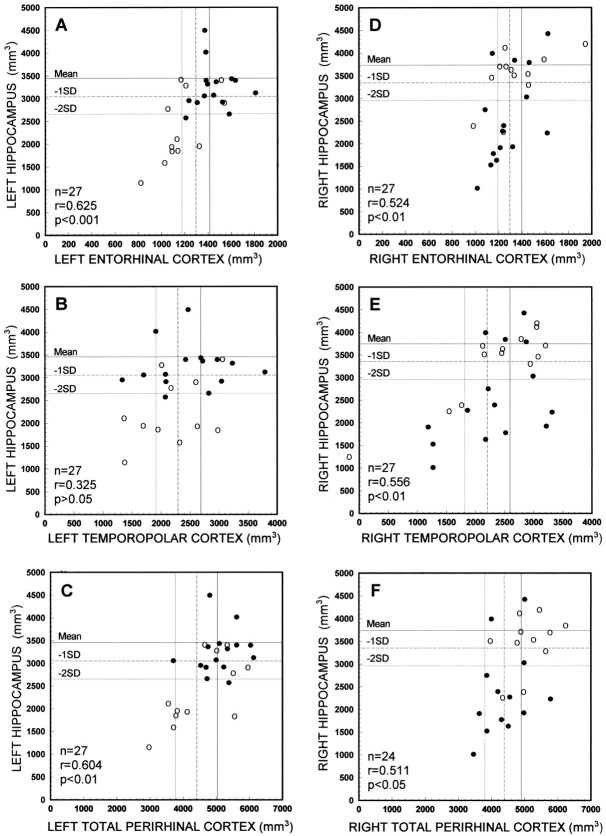
Results: In left TLE, the mean volume of the ipsilateral entorhinal cortex was reduced by 17% (P <.001 compared with control subjects) and that of the ipsilateral temporopolar cortex by 17% (P <.05). In right TLE, the mean ipsilateral entorhinal volume was reduced by 13% (P < or =.01), but only in patients with hippocampal atrophy. Asymmetry ratios also indicated ipsilateral cortical atrophy. When each patient was analyzed individually, the volume of the ipsilateral hippocampus was reduced (> or = 2 SD from the mean of controls) in 63% and that of the entorhinal cortex in 52% of patients with TLE. Furthermore, ipsilateral entorhinal (left: r = 0.625, P <.001; right: r = 0.524, P < or =.01), perirhinal (left: r = 0.471, P <.05), and temporopolar (right: r = 0.556, P <.01) volumes correlated with ipsilateral hippocampal volumes. There was no association, however, with clinically or pathologically identified causes of epilepsy, duration of epilepsy, or age at onset of epilepsy. Mean cortical volumes were unaffected in extratemporal partial epilepsy.
Conclusion: Subpopulations of patients with unilateral TLE have ipsilateral damage in the entorhinal and temporopolar cortices. The damage is associated with hippocampal damage.
Figures
Similar articles
-
Entorhinal cortex MRI assessment in temporal, extratemporal, and idiopathic generalized epilepsy.Epilepsia. 2003 Aug;44(8):1070-4. doi: 10.1046/j.1528-1157.2003.64802.x. Epilepsia. 2003. PMID: 12887438
-
Quantitative MRI volumetry of the entorhinal cortex in temporal lobe epilepsy.Seizure. 2000 Apr;9(3):208-15. doi: 10.1053/seiz.1999.0373. Seizure. 2000. PMID: 10775518
-
Mesial temporal damage in temporal lobe epilepsy: a volumetric MRI study of the hippocampus, amygdala and parahippocampal region.Brain. 2003 Feb;126(Pt 2):462-9. doi: 10.1093/brain/awg034. Brain. 2003. PMID: 12538412
-
Perirhinal cortex and temporal lobe epilepsy.Front Cell Neurosci. 2013 Aug 29;7:130. doi: 10.3389/fncel.2013.00130. Front Cell Neurosci. 2013. PMID: 24009554 Free PMC article. Review.
-
Medial temporal cortices in ex vivo magnetic resonance imaging.J Comp Neurol. 2013 Dec 15;521(18):4177-88. doi: 10.1002/cne.23432. J Comp Neurol. 2013. PMID: 23881818 Free PMC article. Review.
Cited by
-
Reduced inhibition and increased output of layer II neurons in the medial entorhinal cortex in a model of temporal lobe epilepsy.J Neurosci. 2003 Sep 17;23(24):8471-9. doi: 10.1523/JNEUROSCI.23-24-08471.2003. J Neurosci. 2003. PMID: 13679415 Free PMC article.
-
Borders, extent, and topography of human perirhinal cortex as revealed using multiple modern neuroanatomical and pathological markers.Hum Brain Mapp. 2010 Sep;31(9):1359-79. doi: 10.1002/hbm.20940. Hum Brain Mapp. 2010. PMID: 20082329 Free PMC article.
-
Embryonic stem cell-derived neural precursor grafts for treatment of temporal lobe epilepsy.Neurotherapeutics. 2009 Apr;6(2):263-77. doi: 10.1016/j.nurt.2009.01.011. Neurotherapeutics. 2009. PMID: 19332319 Free PMC article. Review.
-
The piriform, perirhinal, and entorhinal cortex in seizure generation.Front Neural Circuits. 2015 May 29;9:27. doi: 10.3389/fncir.2015.00027. eCollection 2015. Front Neural Circuits. 2015. PMID: 26074779 Free PMC article. Review.
-
Medial temporal lobe atrophy in patients with refractory temporal lobe epilepsy.J Neurol Neurosurg Psychiatry. 2003 Dec;74(12):1627-30. doi: 10.1136/jnnp.74.12.1627. J Neurol Neurosurg Psychiatry. 2003. PMID: 14638879 Free PMC article.
References
-
- Amaral DG, Insausti R. Hippocampal formation. In: Paxinos G, ed. The Human Nervous System. San Diego, Calif: Academic Press; 1990;711–755
-
- Babb TL, Pretorius JK. Pathologic substrates of epilepsy. In: Wyllie E, ed. The Treatment of Epilepsy: Principles and Practice 2nd ed. Philadelphia, Pa: Williams & Wilkins; 1997;106–121
-
- Pitkänen A, Salmenperä T, Äikiä M, Partanen K, Kälviäinen R. Seizure-induced damage to the medial temporal lobe in temporal lobe epilepsy. In: Sillanpää M, Gram L, Johannesen SI, Tomson T, eds. Epilepsy and Mental Retardation. Philadelphia, Pa: Wrightson Biomedical Publishing Ltd; 1999;147–163
-
- Amaral DG, Insausti R, Cowan WM. The entorhinal cortex of the monkey: cytoarchitectonic organization. J Comp Neurol 1987;264:326-355 - PubMed
-
- Insausti R, Amaral DG, Cowan WM. The entorhinal cortex of the monkey: cortical afferents. J Comp Neurol 1987;264:356-395 - PubMed
Publication types
MeSH terms
LinkOut - more resources
Full Text Sources
Medical