

Activation of human alpha1 and alpha2 homomeric glycine receptors by taurine and GABA
- PMID: 11559772
- PMCID: PMC2278820
- DOI: 10.1111/j.1469-7793.2001.t01-1-00741.x
Activation of human alpha1 and alpha2 homomeric glycine receptors by taurine and GABA
Abstract
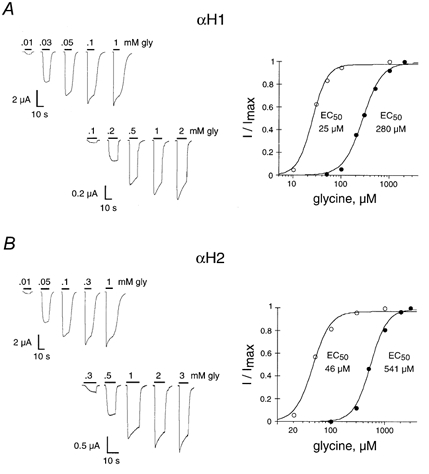
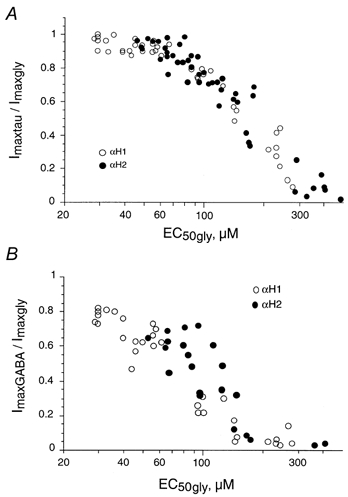
1. Two ligand binding alpha subunits, alpha1 and alpha2, of the human (H) glycine receptor (GlyR) are involved at inhibitory synapses in the adult and neonatal spinal cord, respectively. The ability of homomeric alphaH1 and alphaH2 GlyRs to be activated by glycine, taurine and GABA was studied in Xenopus oocytes or in the human embryonic kidney HEK-293 cell line. 2. In outside-out patches from HEK cells, glycine, taurine and GABA activated both GlyRs with the same main unitary conductance, i.e. 85 +/- 3 pS (n = 6) for alphaH1, and 95 +/- 5 pS (n = 4) for alphaH2. 3. The sensitivity of both alphaH1 and alphaH2 GlyRs to glycine was highly variable. In Xenopus oocytes the EC50 for glycine (EC50gly) was between 25 and 280 microM for alphaH1 (n = 44) and between 46 and 541 microM for alphaH2 (n = 52). For both receptors, the highest EC50gly values were found on cells with low maximal glycine responses. 4. The actions of taurine and GABA were dependent on the EC50gly: (i) their EC50 values were linearly correlated to EC50gly, with EC50tau approximately 10 EC50gly and EC50GABA approximately 500-800 EC50gly; (ii) they could act either as full or weak agonists depending on the EC50gly. 5. The Hill coefficient (n(H)) of glycine remained stable regardless of the EC50gly whereas n(H) for taurine decreased with increasing EC50tau. 6. The degree of desensitization, evaluated by fast application of saturating concentrations of agonist on outside-out patches from Xenopus oocytes, was similar for glycine and taurine on both GlyRs and did not exceed 50 %. 7. Our data concerning the variations of EC50gly and the subsequent behaviour of taurine and GABA could be qualitatively described by the simple del Castillo-Katz scheme, assuming that the agonist gating constant varies whereas the binding constants are stable. However, the stability of the Hill coefficient for glycine was not explained by this model, suggesting that other mechanisms are involved in the modulation of EC50.
Figures


Similar articles
-
Kinetic and mutational analysis of Zn2+ modulation of recombinant human inhibitory glycine receptors.J Physiol. 2000 Jan 15;522 Pt 2(Pt 2):215-30. doi: 10.1111/j.1469-7793.2000.t01-1-00215.x. J Physiol. 2000. PMID: 10639099 Free PMC article.
-
Comparison of glycine and GABA actions on the zebrafish homomeric glycine receptor.J Physiol. 1999 Jun 1;517 ( Pt 2)(Pt 2):369-83. doi: 10.1111/j.1469-7793.1999.0369t.x. J Physiol. 1999. PMID: 10332088 Free PMC article.
-
Positive allosteric modulators differentially affect full versus partial agonist activation of the glycine receptor.J Pharmacol Exp Ther. 2012 Jul;342(1):61-70. doi: 10.1124/jpet.112.191486. Epub 2012 Apr 3. J Pharmacol Exp Ther. 2012. PMID: 22473615 Free PMC article.
-
The intracellular domain of homomeric glycine receptors modulates agonist efficacy.J Biol Chem. 2021 Jan-Jun;296:100387. doi: 10.1074/jbc.RA119.012358. Epub 2021 Feb 20. J Biol Chem. 2021. PMID: 33617876 Free PMC article.
-
GABA(A) receptor and glycine receptor activation by paracrine/autocrine release of endogenous agonists: more than a simple communication pathway.Mol Neurobiol. 2011 Aug;44(1):28-52. doi: 10.1007/s12035-011-8185-1. Epub 2011 May 6. Mol Neurobiol. 2011. PMID: 21547557 Review.
Cited by
-
Aplysia cys-loop glutamate-gated chloride channels reveal convergent evolution of ligand specificity.J Mol Evol. 2009 Aug;69(2):125-41. doi: 10.1007/s00239-009-9256-z. Epub 2009 Jun 25. J Mol Evol. 2009. PMID: 19554247
-
GABA(A) Receptors: Post-Synaptic Co-Localization and Cross-Talk with Other Receptors.Front Cell Neurosci. 2011 Jun 22;5:7. doi: 10.3389/fncel.2011.00007. eCollection 2011. Front Cell Neurosci. 2011. PMID: 21734865 Free PMC article.
-
Glycine Receptors Caught between Genome and Proteome - Functional Implications of RNA Editing and Splicing.Front Mol Neurosci. 2009 Nov 9;2:23. doi: 10.3389/neuro.02.023.2009. eCollection 2009. Front Mol Neurosci. 2009. PMID: 19936314 Free PMC article.
-
Contributions of conserved residues at the gating interface of glycine receptors.J Biol Chem. 2011 Oct 7;286(40):35129-36. doi: 10.1074/jbc.M111.269027. Epub 2011 Aug 11. J Biol Chem. 2011. PMID: 21835920 Free PMC article.
-
Differential GABAergic and glycinergic inputs of inhibitory interneurons and Purkinje cells to principal cells of the cerebellar nuclei.J Neurosci. 2014 Jul 9;34(28):9418-31. doi: 10.1523/JNEUROSCI.0401-14.2014. J Neurosci. 2014. PMID: 25009273 Free PMC article.
References
-
- Ali DW, Drapeau P, Legendre P. Development of spontaneous glycinergic currents in the Mauthner neuron of the zebrafish embryo. Journal of Neurophysiology. 2000;84:1726–1736. - PubMed
-
- Betz H, Kuhse J, Schmieden V, Laube B, Kirsch J, Harvey RJ. Structure and functions of inhibitory and excitatory glycine receptors. Annals of the New York Academy of Sciences. 1999;30:667–676. - PubMed
-
- Breitinger HG, Becker CM. The inhibitory glycine receptor: prospects for a therapeutic orphan? Current Pharmaceutical Design. 1998;4:315–334. - PubMed
-
- David-Watine B, Goblet C, De Saint Jan D, Fucile S, Devignot V, Bregestovski P, Korn H. Cloning, expression and electrophysiological characterization of glycine receptor alpha subunit from zebrafish. Neuroscience. 1999;90:303–317. - PubMed
Publication types
MeSH terms
Substances
LinkOut - more resources
Full Text Sources
Other Literature Sources
Molecular Biology Databases
Miscellaneous