Clinical Trial
. 2001 Sep 15;535(Pt 3):855-65.
doi: 10.1111/j.1469-7793.2001.t01-1-00855.x.

Slowly conducting afferents activated by innocuous low temperature in human skin

Affiliations
Clinical Trial

Slowly conducting afferents activated by innocuous low temperature in human skin

M Campero et al. J Physiol. .

Abstract

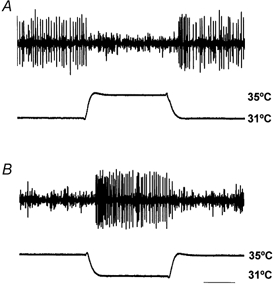
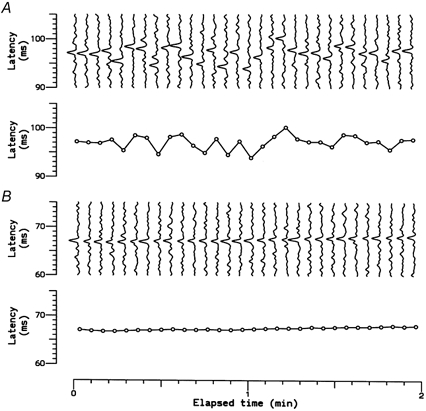
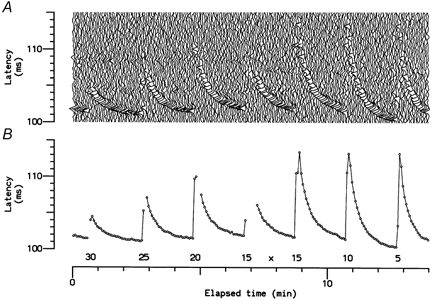
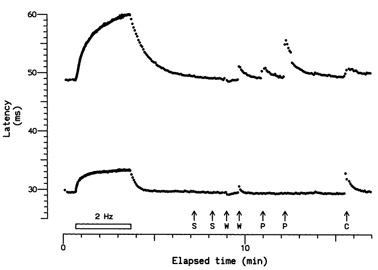
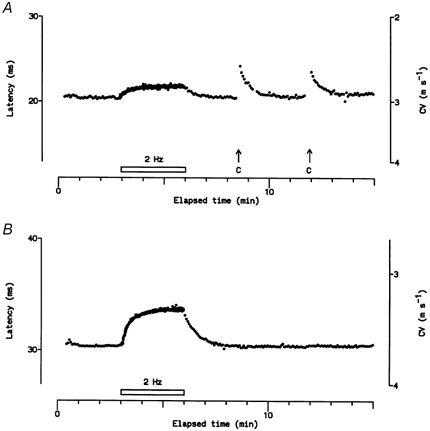
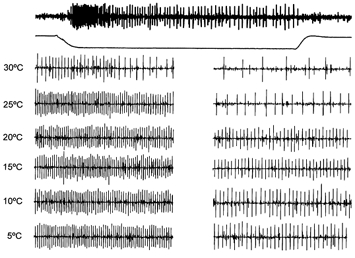
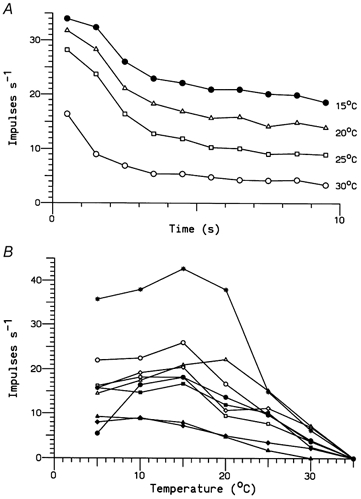
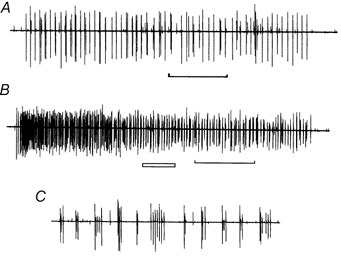
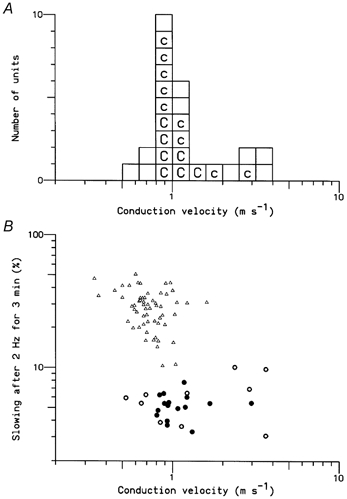
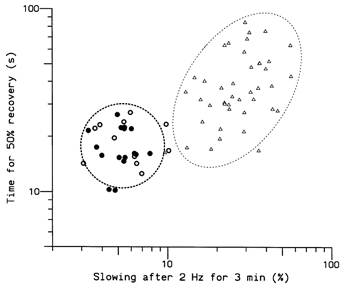
1. Microneurography was used to search for primary afferents responsive to innocuous low temperature in human nerves supplying the hairy skin of the hand or foot. Eighteen units were identified as cold-specific units: they displayed a steady-state discharge at skin temperatures in the range 28-30 degrees C, they were sensitive to small changes in temperature, and they responded vigorously when a cool metal probe touched their receptive fields (RFs). They were insensitive to mechanical stimuli and sympathetic activation. Their RFs comprised one, or at most two, spots less than 5 mm in diameter. 2. Nine units were characterised in detail by a series of 10 s cooling and warming pulses from a holding temperature of 35 degrees C. The threshold temperature for activation by cooling was 29.4 +/- 2.0 degrees C (mean +/- S.D.). Adaptation of the responses to supra-threshold cooling pulses was partial: mean peak and plateau firing rates were maximal on steps to 15 degrees C (35.9 and 19.9 impulses x s(-1), respectively). Three of these units also displayed a paradoxical response to warming, with a mean threshold of 42.3 degrees C. 3. Sixteen of the eighteen cold-specific units were also studied by electrical stimulation of their RFs. They conducted in the velocity range 0.8-3.0 m x s(-1). When stimulated at 2 Hz, their latency increased according to a characteristic time course, reaching a plateau within 3 min (mean slowing (+/- S.D.) 5.2 +/- 1.1 %) and recovering quickly (50 % recovery in 17.8 +/- 4.5 s). 4. To reconcile these findings with previous studies of reaction times and the effects of nerve compression on sensation, it is concluded that either human cold-specific afferent fibres are incompletely myelinated 'BC' fibres, or else there are C as well as A(delta) cold fibres, with the C fibre group contributing little to sensation.


Figures

Figure 1
Figure 1. Resting discharge of C cold fibre at room temperature
A, the resting discharge is temporarily suppressed by sudden warming of the receptive field (RF) from 31 °C to 35 °C (the Peltier device was initially set to 31 °C, since at that temperature the discharge was the same as with the device removed). B, from a holding temperature of 35 °C, at which the unit is silent, activity is initiated by cooling the RF to 31 °C. Time bar: 5 s (NB the nerve signal in this figure and in Figs 4 and 6 has been subjected to a ‘grass-cutting’ filter to reduce noise, so that spike amplitudes appear to be more variable than they actually are).
Figure 2
Figure 2. Resting discharge indicated by latency fluctuations during electrical stimulation of the RF
A, sequence of 30 successive recordings of a single C cold fibre at room temperature (top) and measured latencies, showing latency fluctuations due to the resting discharge (bottom). B, similar recordings from the same unit recorded 10 min later, after the skin had been warmed by radiant heat (to ≈35 °C) to suppress resting discharge.
Figure 3
Figure 3. Latency changes during thermal testing
A, successive recordings from a single C cold fibre electrically stimulated at 0.25 Hz during testing with 10 s temperature pulses. B, measured latencies, showing activity-dependent slowing. Gaps indicate sweeps in which the response of the unit could not be identified. Numbers indicate the plateau level of temperature pulses (in °C). ‘x’ indicates the point when the electrical stimulus was increased, to overcome activity-dependent failure to excite.
Figure 7
Figure 7. Comparison of responses of two C units to electrical and natural stimulation
Activity-dependent slowing of two units recorded at the same time in response to electrical stimulation at 2 Hz for 3 min, and to a sequence of natural stimuli: S, sympathetic activation by the subject taking a deep breath and by a loud, unexpected noise; W, warm metal probe applied to the RF (note slight reduction in latency in response to the first application, due to warming of the axons, and abrupt latency increases due to activity caused by the second application); P, pressure from von Frey monofilaments (6.69 and 11.61 bar), which excited only the upper unit; and C, cool metal probe applied to the RF (note the slow onset of slowing of the upper unit, probably caused only by cooling of the axon, in contrast to the abrupt onset of slowing of the lower unit, caused by activity). The upper unit was classified as ‘type 1′ from its response to 2 Hz stimulation, and as a polymodal nociceptor from its responses to heat and pressure, while the lower unit was classified as ‘type 2′ (plateau unit), from its response to electrical stimulation, and as a cold unit (with a paradoxical response) from its responses to natural stimulation.
Figure 8
Figure 8. Type 2 units conducting at Aδ velocities
A, responses of a unit conducting at nearly 3 m s−1 to repetitive electrical and natural stimulation. C, application of a cold metal rod to the RF. B, response of an unidentified unit conducting at 3.6 m s−1 to repetitive electrical stimulation. This unit was considered to be a probable cold-specific receptor from its latency profile (cf. lower unit in Fig. 7). The latency and conduction velocity (CV) scales are logarithmic.
Figure 4
Figure 4. Responses of a single C cold fibre to 10 s temperature pulses
The top trace shows the full response to a temperature pulse from the baseline skin temperature of 35 °C to 30 °C, with the temperature profile shown below. The set of traces beneath these represent expanded 1 s sections of responses showing peak phasic (left) and tonic (right) discharges, for temperature steps from 35 °C to the temperatures indicated. The rate of temperature change at the start and end of the pulses was 10 °C s−1. The unit was silent between temperature pulses. These responses were filtered as in Fig. 1.
Figure 5
Figure 5. Responses of C cold fibres to 10 s temperature pulses
A, mean discharge frequencies when the temperature was lowered from 35 °C to 30, 25, 20 and 15 °C for 10 s. Each point represents the number of impulses in 1 s averaged over nine units. B, tonic discharge frequencies (averaged over the final 4 s) plotted as a function of temperature for all nine units. Different symbols represent different temperatures in A and different fibres in B.
Figure 6
Figure 6. Paradoxical response to heat of a single C cold fibre
A, activity provoked by warming the skin from 35 °C to 40 °C for 10 s. B, response to a 10 s pulse to 45 °C. C, expansion of the period marked by the open bar in B, showing the tendency of the unit to discharge in bursts. The time marker for A and B indicates 2 s. The responses were filtered as in Fig. 1.
Figure 9
Figure 9. CVs and activity-dependent slowing in cold and other type 2 units
A, Distribution of CVs (logarithmic scale). Each box represents a single type 2 unit: ‘c’ denotes units identified as cold-specific receptors, ‘C’ indicates units that were fully characterised. B, relationship between CV and the degree of slowing after stimulation at 2 Hz for 3 min. The triangles represent the 80 type 1 units. The thick and filled circles represent the 26 type 2 units. The filled circles indicate cold-specific receptors.
Figure 10
Figure 10. Rates of recovery following repetitive stimulation
Times taken for the latency of a unit to recover half-way towards the resting value after stimulation at 2 Hz for 3 min. Triangles represent the 40 type 1 units. Circles represent the 29 type 2 units; filled circles indicate cold-specific receptors. Dashed ellipses are 95 % confidence limits for a single unit type.

References

    1. Adriaensen H, Gybels J, Handwerker HO, Van Hees J. Response properties of thin myelinated (A-δ) fibers in human skin nerves. Journal of Neurophysiology. 1983;49:111–122. - PubMed
    1. Campero M, Serra J, Ochoa JL. C-polymodal nociceptors activated by noxious low temperature in human skin. Journal of Physiology. 1996;497:565–572. - PMC - PubMed
    1. Darian-Smith I. Thermal sensibility. In: Darian-Smith I, editor. Handbook of Physiology, section 1, The Nervous System, Sensory Processes. Vol. 3. Bethesda, MD, USA: American Physiological Society; 1984. pp. 879–913. part 2.
    1. Darian-Smith I, Johnson KO, Dykes R. Cold’ fibre population innervating palmar and digital skin of the monkey: responses to cooling pulses. Journal of Neurophysiology. 1973;36:325–346. - PubMed
    1. Dodt E, Zotterman Y. The discharge of specific cold fibres at high temperatures (the paradoxical cold) Acta Physiologica Scandinavica. 1952;26:358–365. - PubMed

Publication types

LinkOut - more resources