

Frequency of spontaneous mutations in an avian hepadnavirus infection
- PMID: 11559794
- PMCID: PMC114533
- DOI: 10.1128/JVI.75.20.9623-9632.2001
Frequency of spontaneous mutations in an avian hepadnavirus infection
Abstract
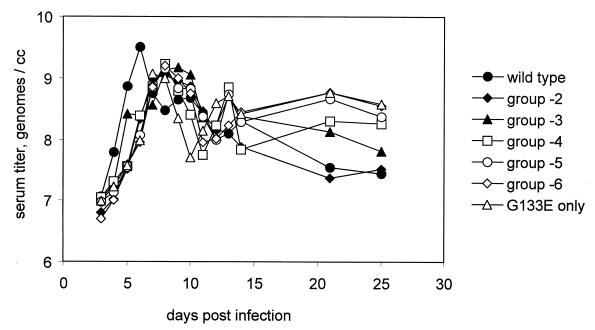
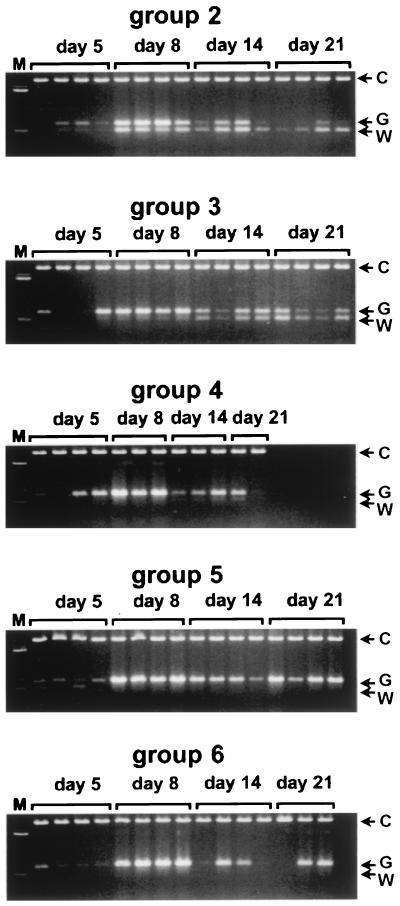
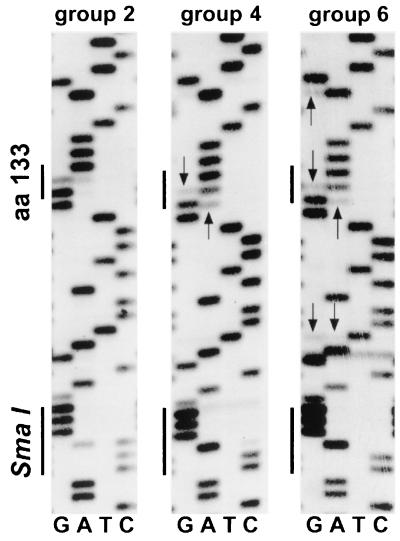
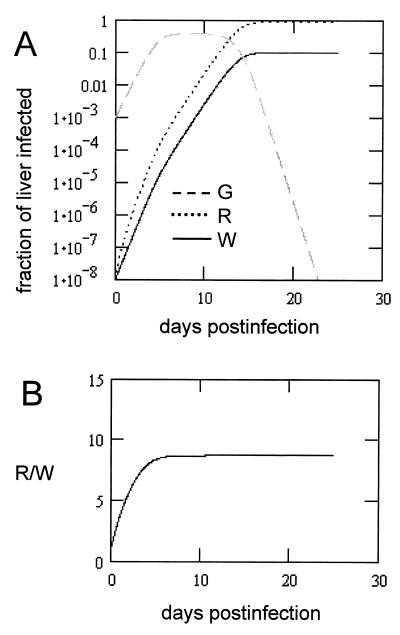
In this study, we measured the frequency of revertants of a cytopathic strain of the duck hepatitis B virus that bears a single nucleotide substitution in the pre-S envelope protein open reading frame, resulting in the amino acid substitution G133E. Cytopathic virus mixed with known amounts of a genetically marked wild-type virus was injected into ducklings. Virus outgrowth was accompanied by a coselection of wild-type and spontaneous revertants during recovery of the ducklings from the acute liver injury caused by death of the G133E-infected cells. The frequency of individual revertants in the selected noncytopathic virus population was estimated by determining the ratio of each revertant to the wild-type virus. Spontaneous revertants were found to be present at frequencies of 1 x 10(-5) to 6 x 10(-5) per G133E genome inoculated. A mathematical model was used to estimate that the mutation rate was 0.8 x 10(-5) to 4.5 x 10(-5) per nucleotide per generation.
Figures


Similar articles
-
Competition in vivo between a cytopathic variant and a wild-type duck hepatitis B virus.Virology. 1998 Nov 10;251(1):85-95. doi: 10.1006/viro.1998.9394. Virology. 1998. PMID: 9813205
-
Acute liver injury following infection with a cytopathic strain of duck hepatitis B virus.Hepatology. 1999 Feb;29(2):563-71. doi: 10.1002/hep.510290236. Hepatology. 1999. PMID: 9918936
-
[Establishment of an in vivo model for duck hepatitis B virus infection using Hubei duckling].Zhonghua Shi Yan He Lin Chuang Bing Du Xue Za Zhi. 2008 Apr;22(2):113-5. Zhonghua Shi Yan He Lin Chuang Bing Du Xue Za Zhi. 2008. PMID: 18574531 Chinese.
-
Duck hepatitis B virus: an invaluable model system for HBV infection.Adv Virus Res. 2004;63:1-70. doi: 10.1016/S0065-3527(04)63001-6. Adv Virus Res. 2004. PMID: 15530560 Review. No abstract available.
-
Animal models and the molecular biology of hepadnavirus infection.Cold Spring Harb Perspect Med. 2015 Apr 1;5(4):a021352. doi: 10.1101/cshperspect.a021352. Cold Spring Harb Perspect Med. 2015. PMID: 25833941 Free PMC article. Review.
Cited by
-
Hepadnavirus Genome Replication and Persistence.Cold Spring Harb Perspect Med. 2015 Jul 1;5(7):a021386. doi: 10.1101/cshperspect.a021386. Cold Spring Harb Perspect Med. 2015. PMID: 26134841 Free PMC article. Review.
-
Hepatitis B Virus Adaptation to the CD8+ T Cell Response: Consequences for Host and Pathogen.Front Immunol. 2018 Jul 16;9:1561. doi: 10.3389/fimmu.2018.01561. eCollection 2018. Front Immunol. 2018. PMID: 30061882 Free PMC article. Review.
-
Avian and Mammalian hepadnaviruses have distinct transcription factor requirements for viral replication.J Virol. 2002 Aug;76(15):7468-72. doi: 10.1128/jvi.76.15.7468-7472.2002. J Virol. 2002. PMID: 12097559 Free PMC article.
-
Lamivudine/Adefovir Treatment Increases the Rate of Spontaneous Mutation of Hepatitis B Virus in Patients.PLoS One. 2016 Sep 20;11(9):e0163363. doi: 10.1371/journal.pone.0163363. eCollection 2016. PLoS One. 2016. PMID: 27649318 Free PMC article.
-
Identification of a structural motif crucial for infectivity of hepatitis B viruses.Proc Natl Acad Sci U S A. 2006 Apr 25;103(17):6730-4. doi: 10.1073/pnas.0509765103. Epub 2006 Apr 17. Proc Natl Acad Sci U S A. 2006. PMID: 16618937 Free PMC article.
References
-
- Allen M I, Deslauriers M, Andrews C W, Tipples G A, Walters K A, Tyrrell D L, Brown N, Condreay L D. Identification and characterization of mutations in hepatitis B virus resistant to lamivudine. Hepatology. 1998;27:1670–1677. - PubMed
-
- Argentini C, La Sorsa V, Bruni R, D'Ugo E, Giuseppetti R, Rapicetta M. Hepadnavirus evolution and molecular strategy of adaptation in a new host. J Gen Virol. 1999;80:617–626. - PubMed
-
- Blackberg J, Kidd-Ljunggren K. Occult hepatitis B virus after acute self-limited infection persisting for 30 years without sequence variation. J Hepatol. 2000;33:992–997. - PubMed
-
- Carman W F. The clinical significance of surface antigen variants of hepatitis B virus. J Viral Hepatitis. 1997;4:11–20. - PubMed
-
- Domingo E, Escarmis C, Menendez-Arias L, Holland J J. Viral quasispecies and fitness variations. In: Domingo E, Webster R, Holland J, editors. Origin and evolution of viruses. San Diego, Calif: Academic Press, Inc.; 1999. pp. 141–161.
Publication types
MeSH terms
Substances
Grants and funding
LinkOut - more resources
Full Text Sources
