. 2001 Nov;14(3):140-51.
doi: 10.1002/hbm.1048.

A method for making group inferences from functional MRI data using independent component analysis

Affiliations

A method for making group inferences from functional MRI data using independent component analysis

V D Calhoun et al. Hum Brain Mapp. 2001 Nov.

Erratum in

  • Hum Brain Mapp 2002 Jun;16(2):131

Abstract

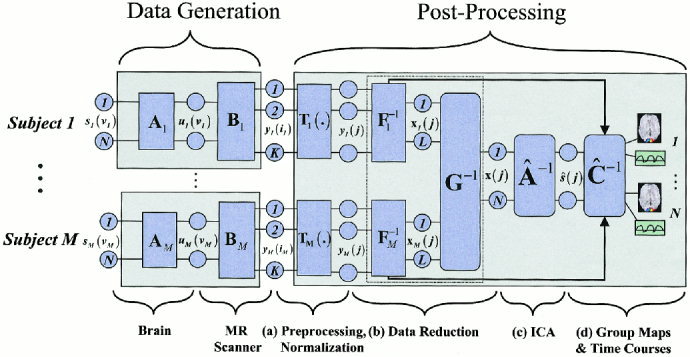
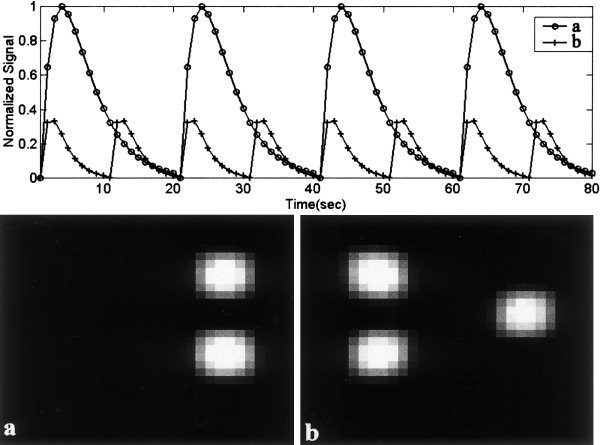
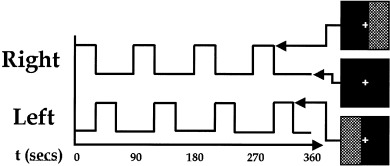
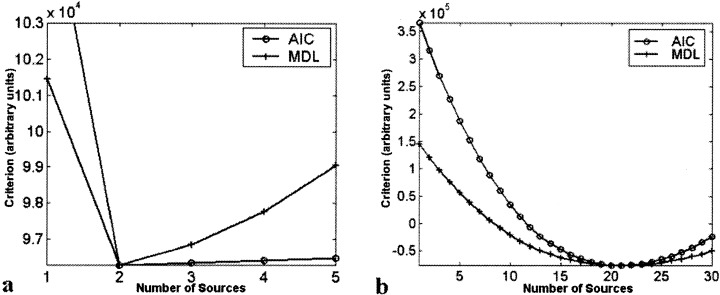
Independent component analysis (ICA) is a promising analysis method that is being increasingly applied to fMRI data. A principal advantage of this approach is its applicability to cognitive paradigms for which detailed models of brain activity are not available. Independent component analysis has been successfully utilized to analyze single-subject fMRI data sets, and an extension of this work would be to provide for group inferences. However, unlike univariate methods (e.g., regression analysis, Kolmogorov-Smirnov statistics), ICA does not naturally generalize to a method suitable for drawing inferences about groups of subjects. We introduce a novel approach for drawing group inferences using ICA of fMRI data, and present its application to a simple visual paradigm that alternately stimulates the left or right visual field. Our group ICA analysis revealed task-related components in left and right visual cortex, a transiently task-related component in bilateral occipital/parietal cortex, and a non-task-related component in bilateral visual association cortex. We address issues involved in the use of ICA as an fMRI analysis method such as: (1) How many components should be calculated? (2) How are these components to be combined across subjects? (3) How should the final results be thresholded and/or presented? We show that the methodology we present provides answers to these questions and lay out a process for making group inferences from fMRI data using independent component analysis.


Figures

Figure 1
Figure 1
Model for the group ICA analysis. The model indicates our assumptions in the data‐generation block and our processing method in the postprocessing block. After spatial normalization and reduction, single subject data are combined together, followed by the independent component analysis, and finally individual subject maps and time courses are reconstructed and a “random effects” estimation is performed.
Figure 2
Figure 2
Simulated hemodynamic mixing functions (top), and spatial “sources” (bottom). Two sources were simulated; source 1 had 3 times the amplitude of source #2 as can be seen from the amplitudes of the hemodynamic mixing functions.
Figure 3
Figure 3
Paradigm used for the fMRI experiment. An 8 Hz reversing checkerboard was presented intermittently in the left and right visual fields. Subjects were instructed to maintain focus on a central crosshair during the 6‐min experiment.
Figure 4
Figure 4
Results from AIC/MDL source estimation for (a) simulated, and (b) fMRI data. Both the AIC and MDL methods indicated the correct number of sources (2) for the simulated data set. For the fMRI data set, both AIC and MDL indicated 21 sources.
Figure 5
Figure 5
Estimated sources and hemodynamic mixing functions. Results are thresholded at p > .001 (t = 4.5, dF = 8) with the regions that surpassed the threshold outlined in red. Both sources are correctly identified. Note that source #2 had a higher degree of variability (both in the time course and in the spatial map) due to the lower amplitude of the original source.
Figure 6
Figure 6
Comparison of (a and c) individual ICA maps with (b and d) back‐reconstructed ICA maps. Note that one of the nine “subjects” had two sources, both of which are successfully detected by the back‐reconstructed ICA maps and the individual ICA maps. Eight of the subjects only had one source, thus the maps for source #2 are just noise. Overall, the two methods yielded similar results.
Figure 7
Figure 7
(a) Single subject results for GLM, (b) back‐reconstructed ICA, and (c) individual ICA. A single slice is presented for each of the nine subjects depicting activation significantly activated when the right (red) and left (blue) visual fields were stimulated. A transiently task‐related component located in the visual cortex is also depicted on the ICA images (green).
Figure 8
Figure 8
Random effects group fMRI results for (a) GLM, and (b) ICA, both thresholded at p < .001 (t = 4.5, df = 8). Five components are presented including task‐related components in right visual cortex (red), left visual cortex (blue); a transiently task‐related component (TTR, green) in bilateral occipital/parietal cortex; and non‐task‐related components in bilateral visual association cortex (NTRV, white outline) and primary auditory cortex (NTRA, pink). (c) Time courses for the components are presented. Standard deviation across the group of nine subjects is indicated for each time course with dotted lines.

References

    1. Akaike H (1974): A new look at statistical model identification. IEEE Trans Automatic Control 19: 716–723.
    1. Bell AJ, Sejnowski TJ (1995): An information maximisation approach to blind separation and blind deconvolution. Neural Computation 7: 1129–1159. - PubMed
    1. Biswal B, Yetkin FZ, Haughton VM, Hyde JS (1995): Functional connectivity in the motor cortex of resting human brain using echo‐planar MRI. Mag Res Med 34: 537–541. - PubMed
    1. Biswal BB, Ulmer JL (1999): Blind source separation of multiple signal sources of FMRI data sets using independent component analysis. J Comput Assist Tomogr 23: 265–271. - PubMed
    1. Calhoun V, Golay X, Pearlson G (2000): Improved FMRI slice timing correction: interpolation errors and wrap around effects. Proceedings, ISMRM, 9th Annual Meeting, Denver.

MeSH terms