. 2001 Sep 17;154(6):1209-23.
doi: 10.1083/jcb.200106089.

The actin-binding protein Hip1R associates with clathrin during early stages of endocytosis and promotes clathrin assembly in vitro

Affiliations

The actin-binding protein Hip1R associates with clathrin during early stages of endocytosis and promotes clathrin assembly in vitro

A E Engqvist-Goldstein et al. J Cell Biol. .

Abstract

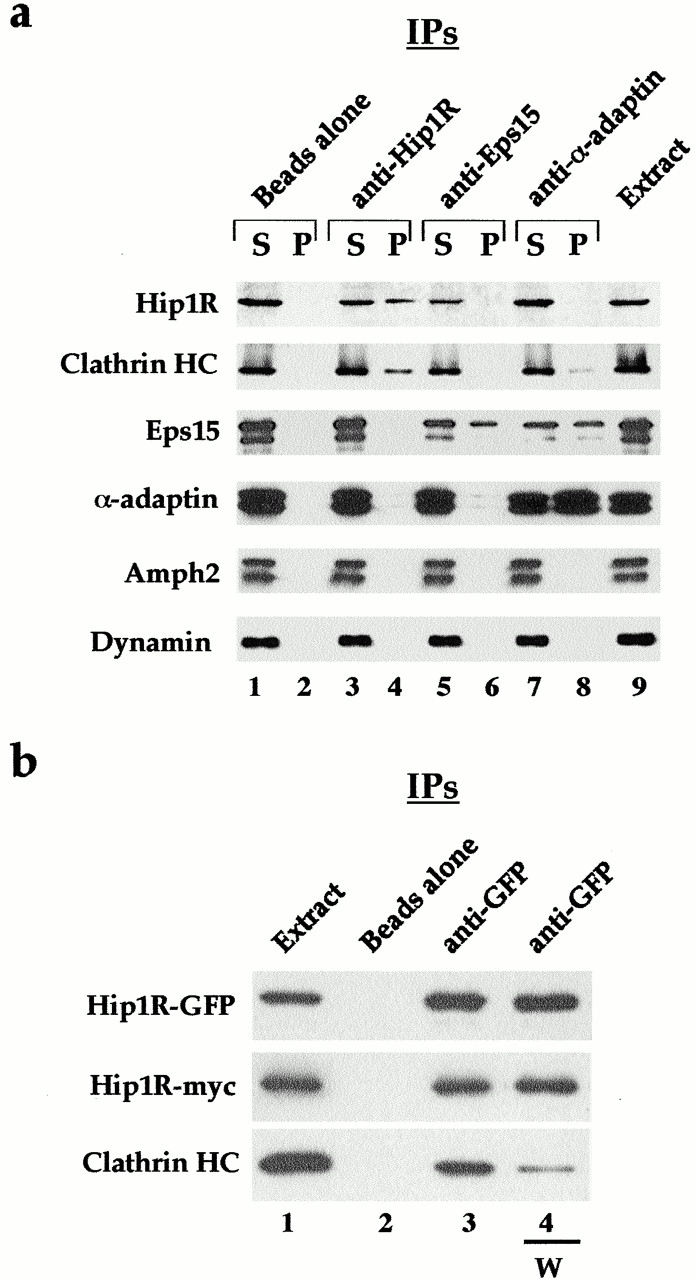
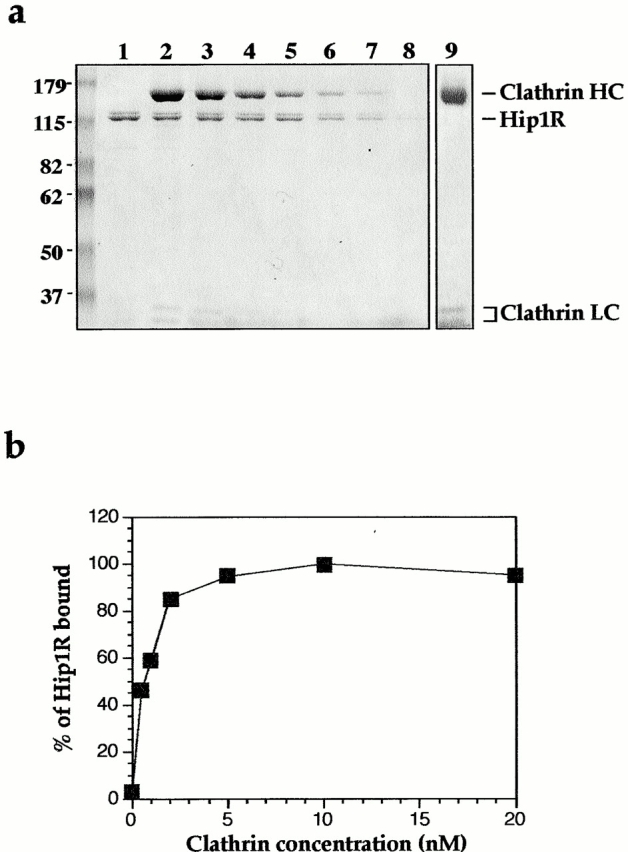
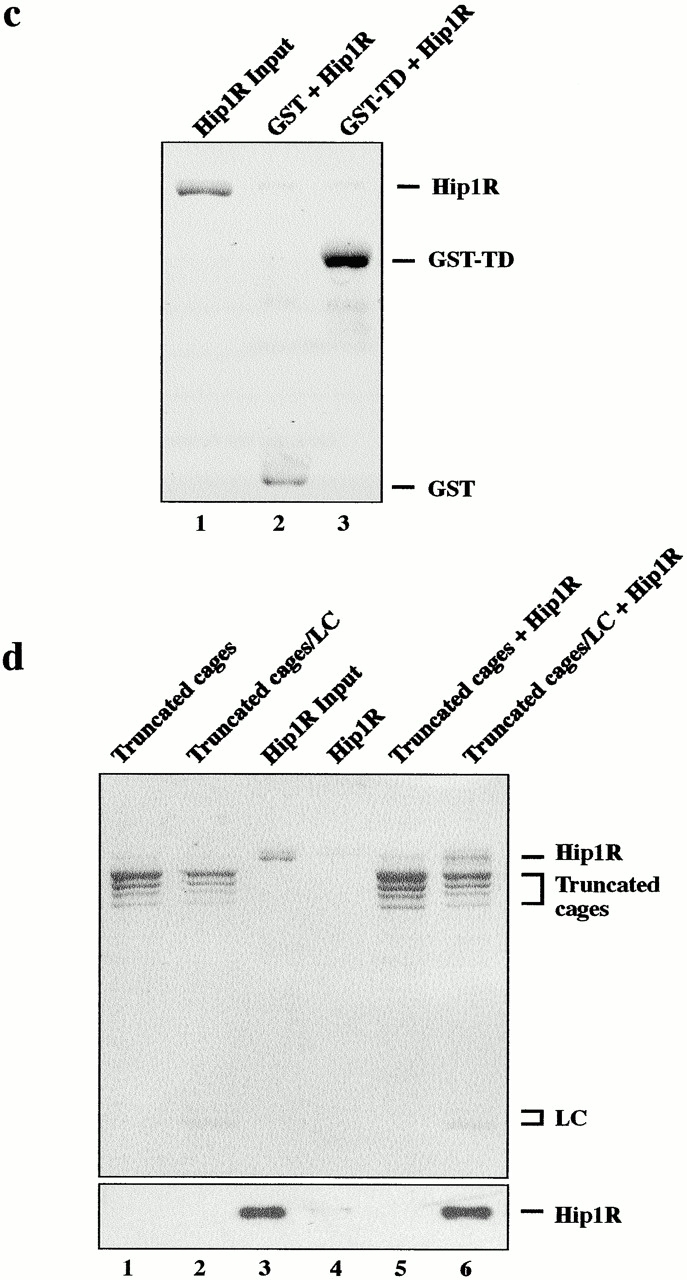
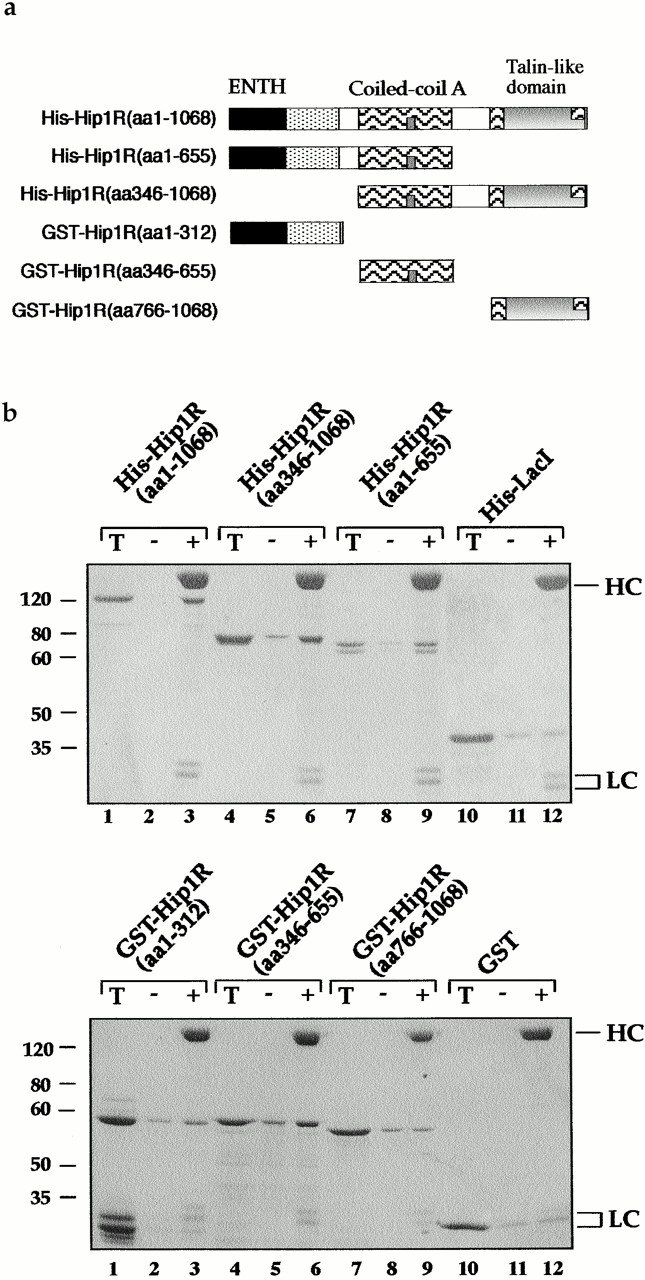
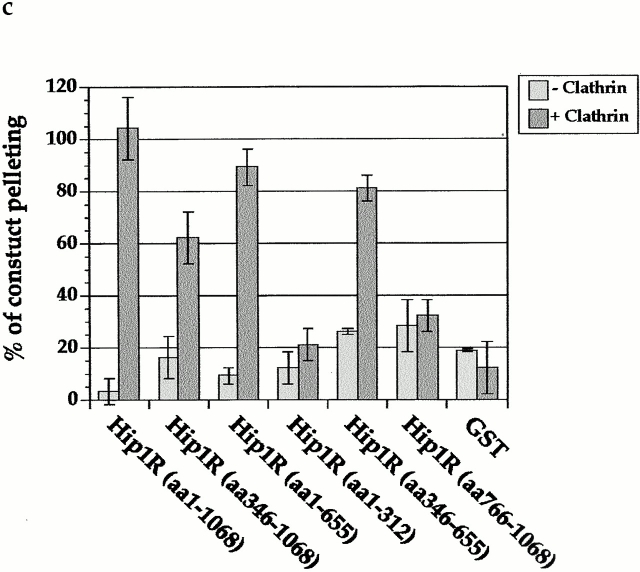
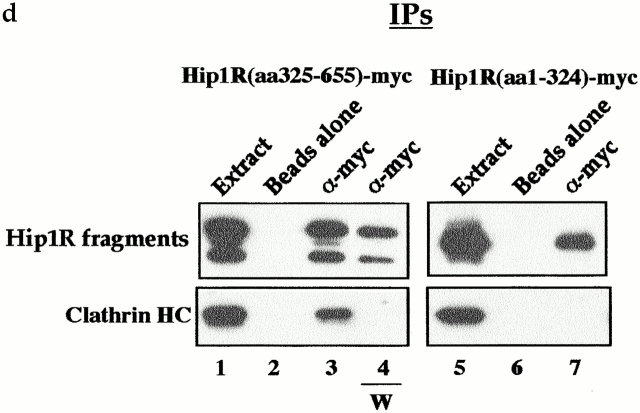
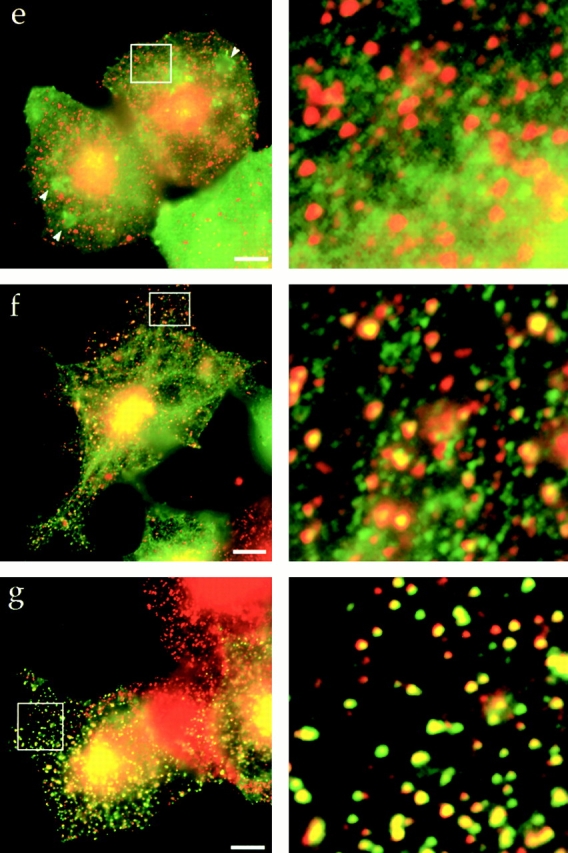
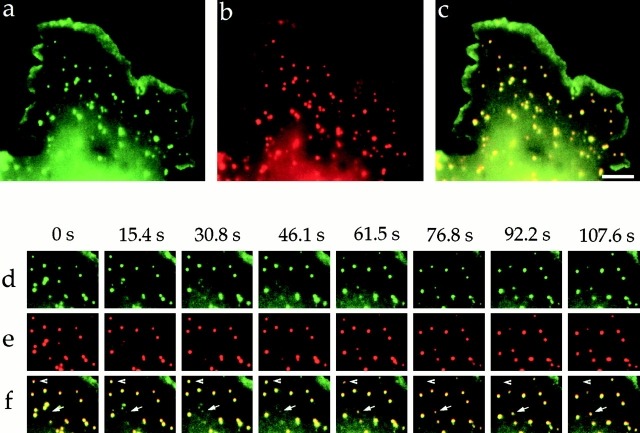
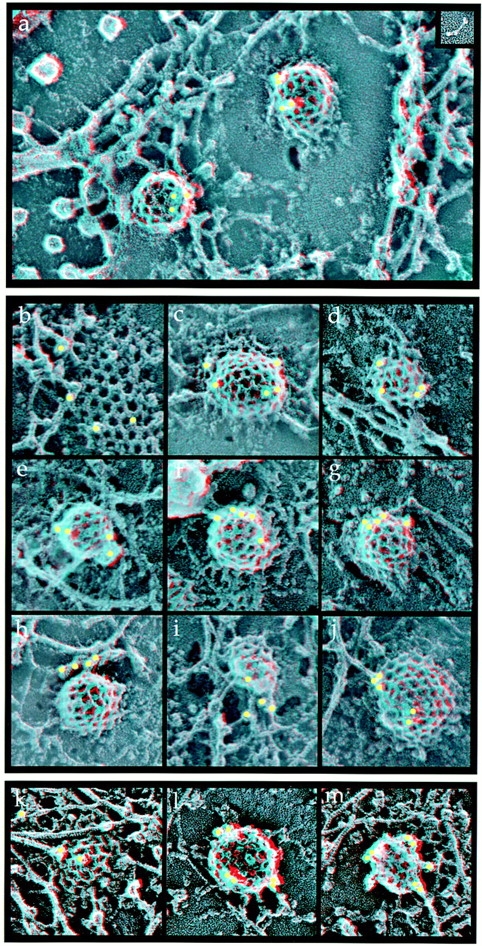
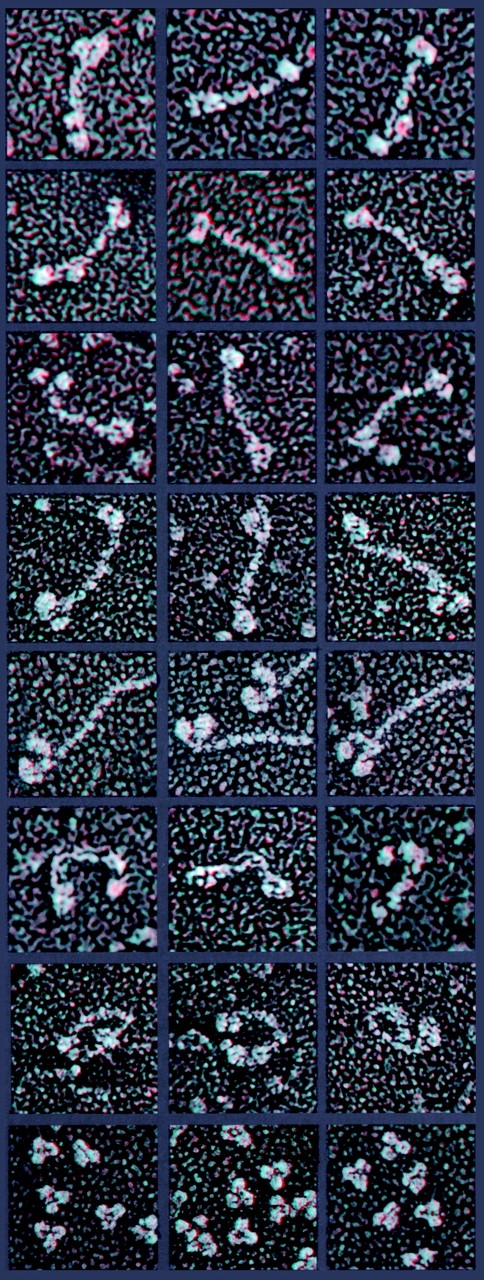
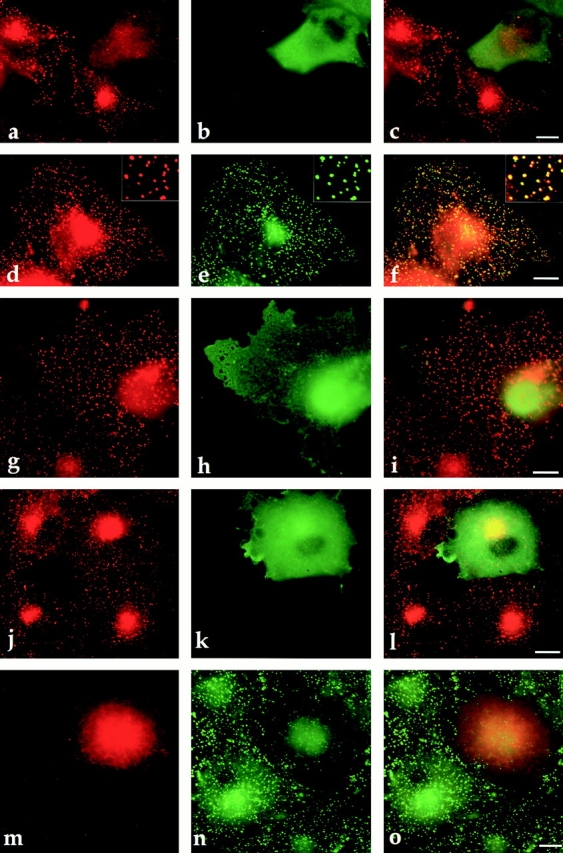
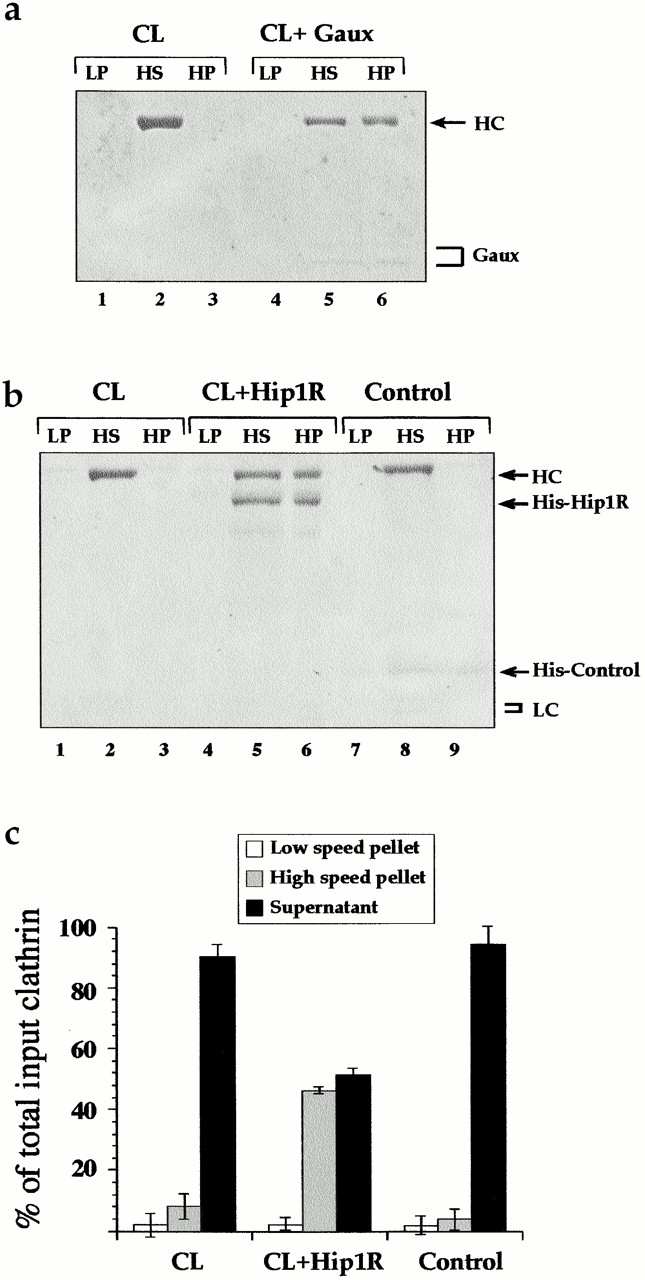
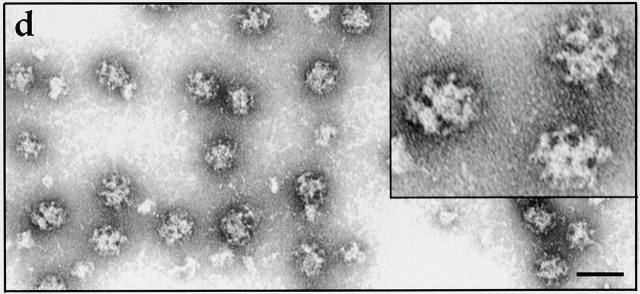
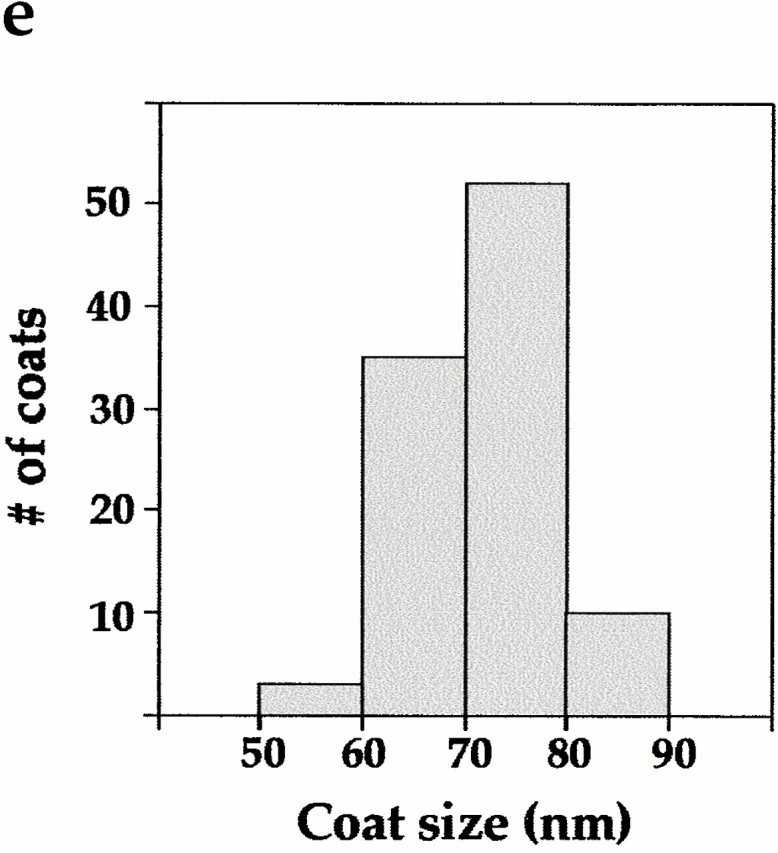
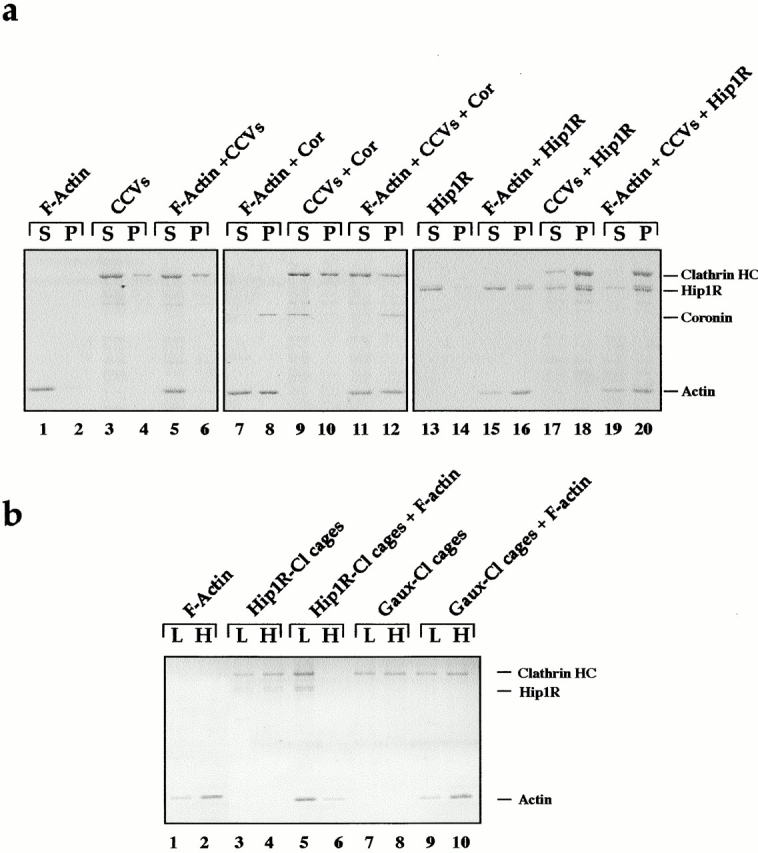
Huntingtin-interacting protein 1 related (Hip1R) is a novel component of clathrin-coated pits and vesicles and is a mammalian homologue of Sla2p, an actin-binding protein important for both actin organization and endocytosis in yeast. Here, we demonstrate that Hip1R binds via its putative central coiled-coil domain to clathrin, and provide evidence that Hip1R and clathrin are associated in vivo at sites of endocytosis. First, real-time analysis of Hip1R-YFP and DsRed-clathrin light chain (LC) in live cells revealed that these proteins show almost identical temporal and spatial regulation at the cell cortex. Second, at the ultrastructure level, immunogold labeling of 'unroofed' cells showed that Hip1R localizes to clathrin-coated pits. Third, overexpression of Hip1R affected the subcellular distribution of clathrin LC. Consistent with a functional role for Hip1R in endocytosis, we also demonstrated that it promotes clathrin cage assembly in vitro. Finally, we showed that Hip1R is a rod-shaped apparent dimer with globular heads at either end, and that it can assemble clathrin-coated vesicles and F-actin into higher order structures. In total, Hip1R's properties suggest an early endocytic function at the interface between clathrin, F-actin, and lipids.


Figures

Figure 1.
Figure 1.
Coimmunoprecipitation of clathrin and Hip1R from an extract prepared from a mouse brain microsomal pellet (a) and from Cos-7 cell homogenate (b). Western blotting of different immunoprecipitation reactions. Antibodies used for immunoprecipitations are indicated at the top of each blot, while antibodies used to probe the blot are shown on the left side. (a) Lanes 1 and 2 show beads alone, lanes 3 and 4 show immunoprecipitation of Hip1R, lanes 5 and 6 show immunoprecipitation of Eps15, and lanes 7 and 8 show immunoprecipitation of α-adaptin. Lane 9 shows the amount of each protein in the extract. Equal portions of supernatant (S) and pellet (P) were loaded. (b) Lane 1 shows the extract and lanes 2–4 show pellets. Lane 2 shown beads alone, lane 3 shows immunoprecipitation of Hip1R–GFP, and lane 4 shows immunoprecipitation of Hip1R–GFP when beads where washed with 0.5 M Tris-HCl (W). The immunoprecipitations were performed three times with similar results.
Figure 2.
Figure 2.
Hip1R binds directly to clathrin cages with high affinity. (a) Coomassie-stained gel of a clathrin cage–pelleting assay. Lane 1 shows total amount of recombinant His6–Hip1R (100 nM final). Lanes 2–8 show pellets from reactions containing 250, 150, 100, 50, 25, 12.5, and 0 nM of clathrin cages with a constant concentration of His6–Hip1R (100 nM). Lane 9 shows the purity of the purified clathrin used in this pelleting assay. (b) The graph shows the percentage of His6–Hip1R bound to clathrin cages as a function of clathrin concentration. In this experiment, 0–20 nM of clathrin cages was used with a constant concentration of Hip1R (8 nM). The bound Hip1R was detected by Western blotting and quantified by densitometry. The data shown are representative of three independent experiments. (c) Hip1R does not bind to GST-TD of clathrin HC (amino acids 1–579) immobilized on glutathione-agarose beads (Coomassie stained gel). Lane 1 shows the total amount of recombinant His6–Hip1R (100 nM final) added. Lane 2 shows a pellet of glutathione-agarose incubated with GST (500 nM) and His6–Hip1R (100 nM). Lane 3 shows a pellet of glutathione-agarose incubated with GST-TD (500 nM) and His6–Hip1R (100 nM). (d) Clathrin LC restores Hip1R binding to truncated cages. Coomassie-stained gel of a clathrin cage–pelleting assay (top). Western blot of Hip1R (bottom). Lanes 1 and 2 show truncated cages and truncated cages reconstituted with intact clathrin LCs, respectively. Lane 3 shows the total amount of recombinant His6–Hip1R (200 nM final) added to the cages. Lane 4 shows Hip1R alone (200 nM). Lane 5 shows truncated cages (∼400 nM) with His6–Hip1R (200 nM). Lane 6 shows truncated cages reconstituted with LC (∼400 nM) with His6–Hip1R (200 nM).
Figure 2.
Figure 2.
Hip1R binds directly to clathrin cages with high affinity. (a) Coomassie-stained gel of a clathrin cage–pelleting assay. Lane 1 shows total amount of recombinant His6–Hip1R (100 nM final). Lanes 2–8 show pellets from reactions containing 250, 150, 100, 50, 25, 12.5, and 0 nM of clathrin cages with a constant concentration of His6–Hip1R (100 nM). Lane 9 shows the purity of the purified clathrin used in this pelleting assay. (b) The graph shows the percentage of His6–Hip1R bound to clathrin cages as a function of clathrin concentration. In this experiment, 0–20 nM of clathrin cages was used with a constant concentration of Hip1R (8 nM). The bound Hip1R was detected by Western blotting and quantified by densitometry. The data shown are representative of three independent experiments. (c) Hip1R does not bind to GST-TD of clathrin HC (amino acids 1–579) immobilized on glutathione-agarose beads (Coomassie stained gel). Lane 1 shows the total amount of recombinant His6–Hip1R (100 nM final) added. Lane 2 shows a pellet of glutathione-agarose incubated with GST (500 nM) and His6–Hip1R (100 nM). Lane 3 shows a pellet of glutathione-agarose incubated with GST-TD (500 nM) and His6–Hip1R (100 nM). (d) Clathrin LC restores Hip1R binding to truncated cages. Coomassie-stained gel of a clathrin cage–pelleting assay (top). Western blot of Hip1R (bottom). Lanes 1 and 2 show truncated cages and truncated cages reconstituted with intact clathrin LCs, respectively. Lane 3 shows the total amount of recombinant His6–Hip1R (200 nM final) added to the cages. Lane 4 shows Hip1R alone (200 nM). Lane 5 shows truncated cages (∼400 nM) with His6–Hip1R (200 nM). Lane 6 shows truncated cages reconstituted with LC (∼400 nM) with His6–Hip1R (200 nM).
Figure 3.
Figure 3.
The central coiled-coil region of Hip1R binds to clathrin in vitro and in vivo. (a) Schematic diagrams of Hip1R domains expressed. (b) Coomassie-stained gel of the cage-pelleting assays. (T) shows the total amount of protein added in the assay, (−) represents pelleting without clathrin cages, and (+) represents pelleting with clathrin cages. For each assay, 600 nM of clathrin cages was used with ∼200 nM of HipR constructs. Because GST–Hip1R (amino acids 1–312) was partially degraded, a higher concentration of this construct was added to give ∼200 nM of nondegraded GST–Hip1R (amino acids 1–312). GST alone and His6LacI were used at ∼400 nM. (c) Graphical representation of results from cage-pelleting assays. The graph shows the percentage of Hip1R fragments pelleting with or without clathrin cages using data from three independent experiments. Error bars denote ±SE. (d) Endogenous clathrin specifically coimmunoprecipitated with Hip1R (amino acids 325–655)-6myc from Cos-7 cell extracts (lane 3). Clathrin was not detected using beads alone (lanes 2 and 6) or when Hip1R (amino acids 1–324)-6myc was immunoprecipitated (lane 7). The clathrin–Hip1R interaction was diminished when the beads were washed with buffer containing 0.5 M Tris-HCl (lane 4). Lanes 1 and 5 show extracts and lanes 2–4 and lanes 6 and 7 show pellets. (e–g and enlargements) Indirect immunofluorescence of endogenous clathrin HC (red) and myc-tagged Hip1R constructs (green) in Cos-7 cells. (e) Hip1R (amino acids 1–324)-6myc. (f) Hip1R (amino acids 325–655)-6myc. (g) Hip1R (amino acids 1–655)-6myc. Bar, 10 μm.
Figure 3.
Figure 3.
The central coiled-coil region of Hip1R binds to clathrin in vitro and in vivo. (a) Schematic diagrams of Hip1R domains expressed. (b) Coomassie-stained gel of the cage-pelleting assays. (T) shows the total amount of protein added in the assay, (−) represents pelleting without clathrin cages, and (+) represents pelleting with clathrin cages. For each assay, 600 nM of clathrin cages was used with ∼200 nM of HipR constructs. Because GST–Hip1R (amino acids 1–312) was partially degraded, a higher concentration of this construct was added to give ∼200 nM of nondegraded GST–Hip1R (amino acids 1–312). GST alone and His6LacI were used at ∼400 nM. (c) Graphical representation of results from cage-pelleting assays. The graph shows the percentage of Hip1R fragments pelleting with or without clathrin cages using data from three independent experiments. Error bars denote ±SE. (d) Endogenous clathrin specifically coimmunoprecipitated with Hip1R (amino acids 325–655)-6myc from Cos-7 cell extracts (lane 3). Clathrin was not detected using beads alone (lanes 2 and 6) or when Hip1R (amino acids 1–324)-6myc was immunoprecipitated (lane 7). The clathrin–Hip1R interaction was diminished when the beads were washed with buffer containing 0.5 M Tris-HCl (lane 4). Lanes 1 and 5 show extracts and lanes 2–4 and lanes 6 and 7 show pellets. (e–g and enlargements) Indirect immunofluorescence of endogenous clathrin HC (red) and myc-tagged Hip1R constructs (green) in Cos-7 cells. (e) Hip1R (amino acids 1–324)-6myc. (f) Hip1R (amino acids 325–655)-6myc. (g) Hip1R (amino acids 1–655)-6myc. Bar, 10 μm.
Figure 4.
Figure 4.
Time-lapse video microscopy of Hip1R–YFP and DsRed–clathrin-LCa in live cells. These proteins display almost identical behavior at the cell cortex. Images were taken at 3 s intervals over 60 frames, where the lag between Hip1R and clathrin visualization is 1.5 s. (a–c) These images show a low magnification overview of a Cos-7 cell coexpressing Hip1R–YFP (green) and DsRed–clathrin-LCa (red). (a) Hip1R–YFP. (b) DsRed–clathrin-LCa. (c) Merge. (d–f) Selected images at the indicated times show that Hip1R–YFP and DsRed–clathrin-LCa appear (arrow) and disappear (arrowhead) at the same sites with indistinguishable timing. (d) Hip1R–YFP. (e) DsRed-clathrin-LCa. (f) Merge. A video containing images from this figure is available at http://www.jcb.org/content/vol154/issue6. Bar, 5 μm.
Figure 5.
Figure 5.
Hip1R localizes to clathrin-coated pits in vivo. Anaglyph stereo view of the inner surface of “unroofed” PC12 or Cos-7 cells that have been subjected to indirect EM immunocytochemistry with anti-Hip1R primary antibodies and 15 nm gold-tagged secondary antibodies. (a–j) PC12 cells. (k–m) Cos-7 cells. (a) A field showing the inner surface of the plasma membrane. Two clathrin-coated pits are labeled with gold (yellow dots). The inset shows a three-dimensional image of a Hip1R molecule at the same magnification absorbed on mica and visualized by quick-freeze, deep-etch electron microscopy (see also Fig. 6). (b and k) Hip1R labeling of a two-dimensional clathrin lattice. (c–g and l) Hip1R labeling of invaginated coated pits. (h–j, k, and m) In some cases, anti-Hip1R antibodies also labeled filamentous structures that appeared connected to the coated pits. Magnification, 75,000×.
Figure 6.
Figure 6.
A gallery of anaglyph three-dimensional images. Images of Hip1R (rows 1–3, and 6), kinesin (rows 4 and 7), myosin II (row 5), and IgG (row 8) absorbed on mica and visualized by quick-freeze, deep-etch electron microscopy. The total length of the Hip1R molecule is ∼60 nm (±7 nm) with a central long shaft spanning 40 nm (±6 nm). At each end of the central shaft are pairs of 7–10-nm globular heads. We also observed Hip1R molecules that appeared kinked (row 6), a feature shared with kinesin (row 7). Magnification, 28,000×.
Figure 7.
Figure 7.
Overexpression of full-length Hip1R affects the distribution of clathrin LC. (a–l) Indirect immunofluorescence of endogenous clathrin LC (red) or clathrin HC (red) in Cos-7 cells expressing myc-tagged Hip1R constructs (green). (a–c) In cells expressing high levels of Hip1R (amino acids 1–1068)-6myc, clathrin LC is more diffuse and shows reduced staining at the cell cortex. (d–f) At low expression of Hip1R (amino acids 1–1068)-6myc, clathrin LC colocalizes with Hip1R. (g–i) High expression of Hip1R (amino acids 1–324)-6myc does not affect the distribution of clathrin LC. (j–l) Clathrin HC still shows a punctate staining pattern in cells expressing high levels of Hip1R (amino acids 1–1068). (m–o) Indirect immunofluorescence of endogenous Hip1R (green) in Cos-7 cells expressing high levels of DsRed–clathrin LCa (red). Merged images are shown in the right column. Bars, 10 μm.
Figure 8.
Figure 8.
Hip1R promotes clathrin cage assembly in vitro. (a) Clathrin (400 nM) was dialyzed overnight in the absence (CL) or presence of an equimolar quantity of His6–GAK auxilin-like domain (Gaux). Equal proportions of the low speed pellet (LP), high speed supernatant (HS), and high speed pellet (HP) were run on an SDS-PAGE gel which was then stained with Coomassie blue. (b) Clathrin (200 nM) was dialyzed overnight in the absence (CL) or presence of an equimolar quantity of His6–Hip1R or His6–GAK kinase domain (control) as indicated. Equal proportions of the low speed pellet (LP), high speed supernatant (HS), and high speed pellet (HP) were run on an SDS-PAGE gel and stained with Coomassie blue. (c) The graph shows the relative amount of clathrin HC in low speed pellet, high speed supernatant, and high speed pellet using data from three independent experiments. Clathrin HC was quantified by densitometry. Values are expressed as the fraction of total input clathrin. Error bars denote ±SE. (d) Electron microscopy of negatively stained clathrin coat structures formed in the presence of His6–Hip1R. (e) Histogram of coat sizes formed in the presence of His6–Hip1R (n = 100). Bar, 100 nm.
Figure 8.
Figure 8.
Hip1R promotes clathrin cage assembly in vitro. (a) Clathrin (400 nM) was dialyzed overnight in the absence (CL) or presence of an equimolar quantity of His6–GAK auxilin-like domain (Gaux). Equal proportions of the low speed pellet (LP), high speed supernatant (HS), and high speed pellet (HP) were run on an SDS-PAGE gel which was then stained with Coomassie blue. (b) Clathrin (200 nM) was dialyzed overnight in the absence (CL) or presence of an equimolar quantity of His6–Hip1R or His6–GAK kinase domain (control) as indicated. Equal proportions of the low speed pellet (LP), high speed supernatant (HS), and high speed pellet (HP) were run on an SDS-PAGE gel and stained with Coomassie blue. (c) The graph shows the relative amount of clathrin HC in low speed pellet, high speed supernatant, and high speed pellet using data from three independent experiments. Clathrin HC was quantified by densitometry. Values are expressed as the fraction of total input clathrin. Error bars denote ±SE. (d) Electron microscopy of negatively stained clathrin coat structures formed in the presence of His6–Hip1R. (e) Histogram of coat sizes formed in the presence of His6–Hip1R (n = 100). Bar, 100 nm.
Figure 9.
Figure 9.
Hip1R can physically link F-actin and clathrin in vitro. (a) Hip1R crosslinks F-actin and CCVs. SDS-PAGE of a low speed F-actin cosedimentation assay. Equal proportions of the low speed pellet (P) and low speed supernatant (S) were run on an SDS-PAGE gel which was then stained with Coomassie blue. Different components (2 μM F-actin, 0.5 μM Hip1R, 0.5 μM coronin (cor), and 0.2 mg/ml CCVs) were included in the assay as indicated at the top of the gel. (b) Clathrin cages assembled with Hip1R copellet with F-actin at low speed. Clathrin (200–400 nM) was dialyzed overnight in the presence of an equimolar quantity of either His6–Hip1R (200 nM) or His6–GAK auxilin-like domain (400 nM). The Hip1R–clathrin cages and the auxilin–clathrin cages were then tested in an F-actin copelleting assay. Equal proportions of the low speed pellet (L) and the high speed pellet (H) were run on an SDS-PAGE gel which was then stained with silver. Lanes 1 and 2 show F-actin alone. Lanes 3 and 4 show clathrin cages assembled with Hip1R. Lanes 5 and 6 show clathrin cages assembled with Hip1R plus F-actin. Lanes 7 and 8 show clathrin cages assembled with the auxilin-like domain of GAK. Lanes 9 and 10 show clathrin cages assembled with the auxilin-like domain of GAK plus F-actin. The data shown are representative of three independent experiments.

References

    1. Ahle, S., and E. Ungewickell. 1986. Purification and properties of a new clathrin assembly protein. EMBO J. 5:3143–3149. - PMC - PubMed
    1. Ahle, S., and E. Ungewickell. 1990. Auxilin, a newly identified clathrin-associated protein in coated vesicles from bovine brain. J. Cell Biol. 111:19–29. - PMC - PubMed
    1. Brodin, L., P. Low, and O. Shupliakov. 2000. Sequential steps in clathrin-mediated synaptic vesicle endocytosis. Curr. Opin. Neurobiol. 10:312–320. - PubMed
    1. Chopra, V.S., M. Metzler, D.M. Rasper, A.E.Y. Engqvist-Goldstein, R. Singaraja, L. Gan, K.M. Fichter, K. McCutcheon, D. Drubin, D.W. Nicholson, and M.R. Hayden. 2000. HIP12 is a non-proapoptotic member of a gene family including HIP1, an interacting protein with huntingtin. Mamm. Genome. 11:1006–1015. - PubMed
    1. Cremona, O., and P. De Camilli. 2001. Phosphoinositides in membrane traffic at the synapse. J. Cell Sci. 114:1041–1052. - PubMed

Publication types

MeSH terms