. 2001 Sep 17;20(18):5060-9.
doi: 10.1093/emboj/20.18.5060.

Citrin and aralar1 are Ca(2+)-stimulated aspartate/glutamate transporters in mitochondria

Affiliations

Citrin and aralar1 are Ca(2+)-stimulated aspartate/glutamate transporters in mitochondria

L Palmieri et al. EMBO J. .

Abstract

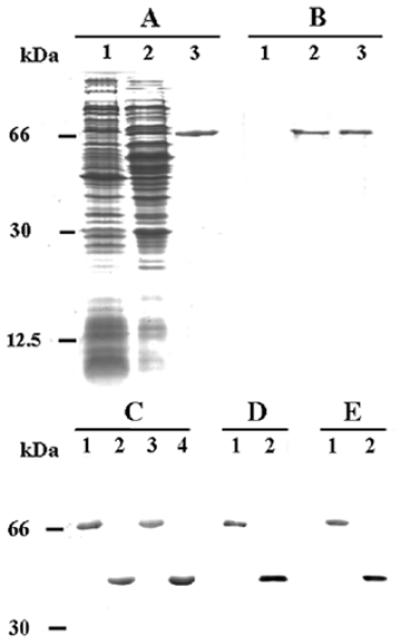
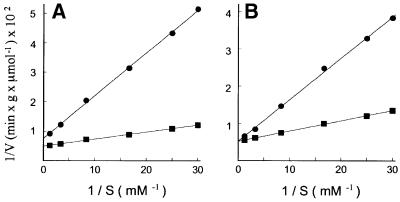
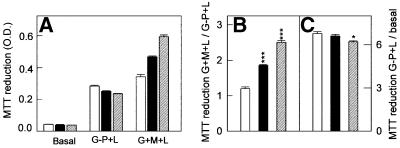
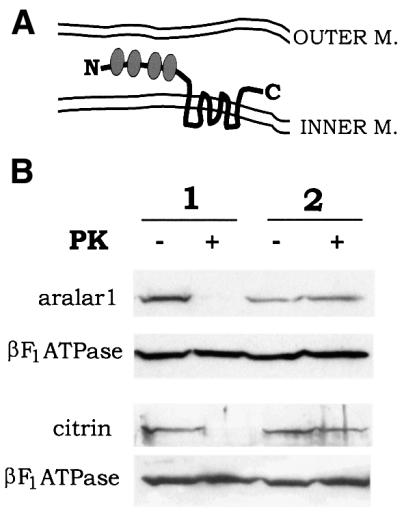
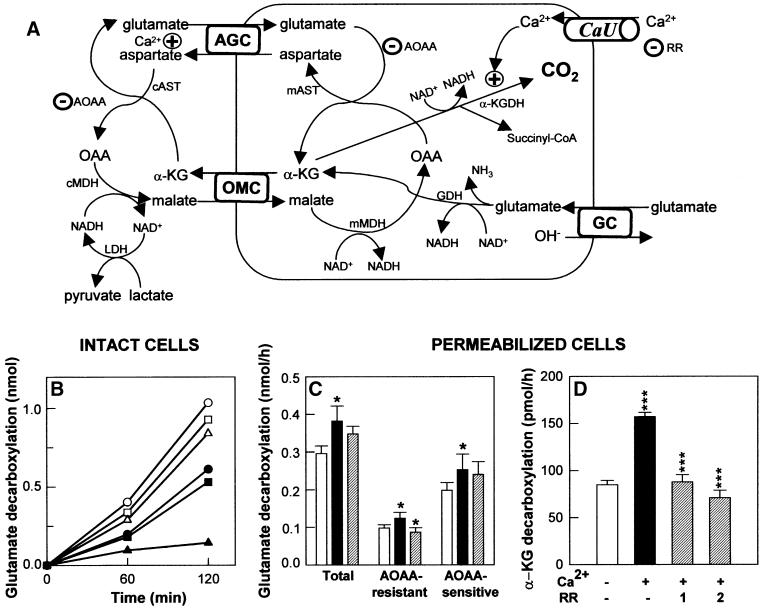
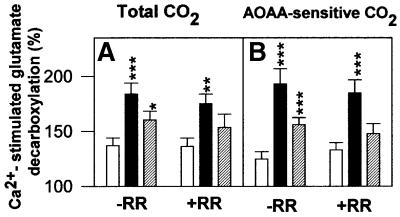
The mitochondrial aspartate/glutamate carrier catalyzes an important step in both the urea cycle and the aspartate/malate NADH shuttle. Citrin and aralar1 are homologous proteins belonging to the mitochondrial carrier family with EF-hand Ca(2+)-binding motifs in their N-terminal domains. Both proteins and their C-terminal domains were overexpressed in Escherichia coli, reconstituted into liposomes and shown to catalyze the electrogenic exchange of aspartate for glutamate and a H(+). Overexpression of the carriers in transfected human cells increased the activity of the malate/aspartate NADH shuttle. These results demonstrate that citrin and aralar1 are isoforms of the hitherto unidentified aspartate/glutamate carrier and explain why mutations in citrin cause type II citrullinemia in humans. The activity of citrin and aralar1 as aspartate/glutamate exchangers was stimulated by Ca(2+) on the external side of the inner mitochondrial membrane, where the Ca(2+)-binding domains of these proteins are localized. These results show that the aspartate/glutamate carrier is regulated by Ca(2+) through a mechanism independent of Ca(2+) entry into mitochondria, and suggest a novel mechanism of Ca(2+) regulation of the aspartate/malate shuttle.


Figures

None
Fig. 1. Bacterial overexpression and purification of citrin, aralar1 and their C-terminal domains. Proteins were separated by SDS–PAGE and either stained with Coomassie Blue dye (A and C) or transferred to nitrocellulose membrane and detected with specific polyclonal antibodies (B, D and E). (A and B) Cells of E.coli CO214(DE3) overexpressing citrin. Samples were taken at induction of expression (lane 1) and 12 h later (lane 2). The same number of bacteria was analyzed in each sample. Lanes 3, 6 µg (A) and 1 µg (B) of purified citrin obtained from bacteria in lane 2 of (A). (C) A 5 µg aliquot of purified citrin (lane 1), its C-terminal domain (lane 2), aralar1 (lane 3) and its C-terminal domain (lane 4). (D) Immunoreaction of 0.2 µg of purified citrin and its C-terminal domain (lanes 1 and 2, respectively) with antiserum to the C-terminal domain. (E) Immunoreaction of 0.2 µg of purified aralar1 and its C-terminal domain (lanes 1 and 2, respectively) with antiserum against the C-terminal domain.
None
Fig. 2. Lineweaver–Burk plots of the [14C]aspartate/aspartate and [14C]glutamate/aspartate exchanges in proteoliposomes reconstituted with citrin. Radioactive aspartate (squares) or glutamate (circles) was added at the concentrations indicated to proteoliposomes containing 20 mM aspartate. Valinomycin (1 µg/mg of phospholipids) and nigericin (50 ng/mg of phospholipids) in ethanol (10 µl/ml of liposomes) (B) or ethanol alone (A) were present in the reaction mixture. All data were determined in one experiment with the same preparation of proteoliposomes. Similar results were obtained in three additional independent experiments.
None
Fig. 3. Reduction of MTT in cells overexpressing aralar1 or citrin. Digitonin (20 µM)-permeabilized HEK-293T cells overexpressing aralar1 (filled bars) or citrin (striped bars) or the empty pIRES vector (open bars) were tested for reduction of MTT in the presence of either 1 mM glutamate, 5 mM malate and 10 mM lactate (G + M + L) or 15 mM glycerol-3-phosphate and 10 mM lactate (G-P + L). Under basal conditions, no substrates were added. (A) Reduction of MTT in the presence of various substrates. (B and C) Normalized MTT reduction. The results (means ± SEM) correspond to a representative experiment performed four times. The differences between controls and cells overexpressing aralar1 or citrin were significant (*P <0.05, ***P <0.001, one-way ANOVA and Bonferroni t-test).
None
Fig. 4. The N-terminal domains of aralar1 and citrin containing the Ca2+-binding sites are exposed to the cytoplasmic surface of the inner mitochondrial membrane. (A) Schematic representation of the topology of aralar1 or citrin in the inner mitochondrial membrane. In the N-terminal domain, the four EF-hand Ca2+-binding motifs are indicated. (B) Proteolysis of aralar1 and citrin with proteinase K. Mitoplasts (1) and mitochondria (2) isolated from rat brain (aralar1) or liver (citrin) were treated with proteinase K as indicated. Each fraction (20 µg protein/lane) was subjected to reaction with an antibody against the N-terminal domain of aralar1 or citrin. As control, analyses were also performed for the β-subunit of F1-ATPase.
None
Fig. 5. Decarboxylation of l-[1-14C]glutamate and [1-14C]α-ketoglutarate in HEK-293T cells. (A) Pathways for glutamate uptake and decarboxylation in mitochondria. AGC, aspartate/glutamate carrier; OMC, α-ketoglutarate/malate carrier; AOAA, aminooxyacetic acid; GC, glutamate/OH-- carrier; CaU, Ca2+ uniporter; RR, ruthenium red; α-KGDH, α-ketoglutarate dehydrogenase; GDH, glutamate dehydrogenase; LDH, lactate dehydrogenase; mAST, cAST, mMDH and cMDH, mitochondrial and cytosolic aspartate aminotransferases and malate dehydrogenases, respectively. (B) Effects of malate and lactate on the pathway of glutamate decarboxylation. HEK-293T cells (∼10 µg protein/well) were incubated in the presence of 1 mM l-[1-14C]glutamate (circles), and 5 mM malate (squares) or 5 mM malate + 10 mM lactate (triangles) for the times shown. AOAA (5 mM) was added where indicated (filled symbols). The data correspond to a single experiment performed in triplicate. It has been repeated 2–3 times with similar results. (C) Effects of Ca2+ and RR on glutamate decarboxylation in permeabilized cells. HEK-293T cells were incubated with 1 mM l-[1-14C]glutamate, 5 mM malate, 10 mM lactate and 20 µM digitonin for 60 min in the presence (AOAA-resistant CO2 production) or absence (total CO2) of 5 mM AOAA with 20 µM CaCl2 (filled bars) or 20 µM CaCl2 + 1 nmol RR/mg protein (striped bars), or without CaCl2 (open bars). AOAA-sensitive CO2 production was the difference between total and AOAA-resistant CO2 production. Results are means ± SEM of five paired experiments performed in triplicate. The difference between incubations with or without Ca2+ and incubations with Ca2+ with or without RR was significant, where indicated (*P <0.05, Wilcoxon signed rank t-test). (D) Inhibition by RR of Ca2+-stimulated α-ketoglutarate decarboxylation in digitonin-permeabilized cells. HEK-293T cells were incubated with 50 µM [1-14C]α-ketoglutarate, 5 mM malate and 20 µM digitonin for 60 min in the presence of 20 µM CaCl2 alone, or together with 1 or 2 nmol RR/mg protein, or in the absence of Ca2+. Data are means ± SEM of four experiments performed in triplicate. The significance of the difference between incubations with Ca2+ and either no Ca2+ or Ca2+ and RR is indicated (***P <0.001, one-way ANOVA followed by Bonferroni t-test).
None
Fig. 6. Ca2+-induced stimulation of glutamate decarboxylation in HEK-293T cells overexpressing aralar1 or citrin. Cultures of HEK-293T cells expressing aralar1 (filled bars), citrin (striped bars) or empty pIRES vector (open bars) were incubated with 1 mM l-[1-14C]glutamate, 5 mM malate, 10 mM lactate and 20 µM digitonin for 60 min in the presence (AOAA-resistant 14CO2 production) or absence (total 14CO2) of 5 mM AOAA, and either 20 µM CaCl2, 20 µM CaCl2 + 1 nmol RR/mg protein, or in the absence of Ca2+. AOAA-sensitive 14CO2 production was the difference between total and AOAA-resistant 14CO2 production. The results, expressed as percentage of 14CO2 formation in the absence of Ca2+, are means ± SEM of 4–9 experiments performed in triplicate. The significance of the difference between cells expressing aralar1 or citrin and controls is indicated (*P <0.05, **P <0.025, Mann–Whitney t-test, ***P< 0.001, one-way ANOVA followed by Bonferroni t-test).

References

    1. Berridge M.V. and Tan,A.S. (1993) Characterization of the cellular reduction of 3-(4,5-dimethylthiazol-2-yl)-2,5-diphenyltetrazolium bromide (MTT): subcellular localization, substrate dependence, and involvement of mitochondrial electron transport in MTT reduction. Arch. Biochem. Biophys., 303, 474–482. - PubMed
    1. Bisaccia F., De Palma,A. and Palmieri,F. (1992) Identification and purification of the aspartate/glutamate carrier from bovine heart mitochondria. Biochim. Biophys. Acta, 1106, 291–296. - PubMed
    1. Brown L.J., MacDonald,M.J., Lehn,D.A. and Moran,S.M. (1994) Sequence of rat mitochondrial glycerol-3-phosphate dehydrogenase cDNA. J. Biol. Chem., 269, 14363–14366. - PubMed
    1. Bunger R. and Mallet,R.T. (1993) Mitochondrial pyruvate transport in working guinea-pig heart. Work-related vs. carrier-mediated control of pyruvate oxidation. Biochim. Biophys. Acta, 1151, 223–236. - PubMed
    1. Csordás G., Thomas,A.P. and Hajnóczky,G. (1999) Quasi-synaptic calcium signal transmission between endoplasmic reticulum and mitochondria. EMBO J., 18, 96–108. - PMC - PubMed

Publication types

MeSH terms