. 2001 Oct;183(20):6017-27.
doi: 10.1128/JB.183.20.6017-6027.2001.

Regulatory interactions of Csr components: the RNA binding protein CsrA activates csrB transcription in Escherichia coli

Affiliations

Regulatory interactions of Csr components: the RNA binding protein CsrA activates csrB transcription in Escherichia coli

S Gudapaty et al. J Bacteriol. 2001 Oct.

Erratum in

  • J Bacteriol 2002 Feb;184(3):871

Abstract

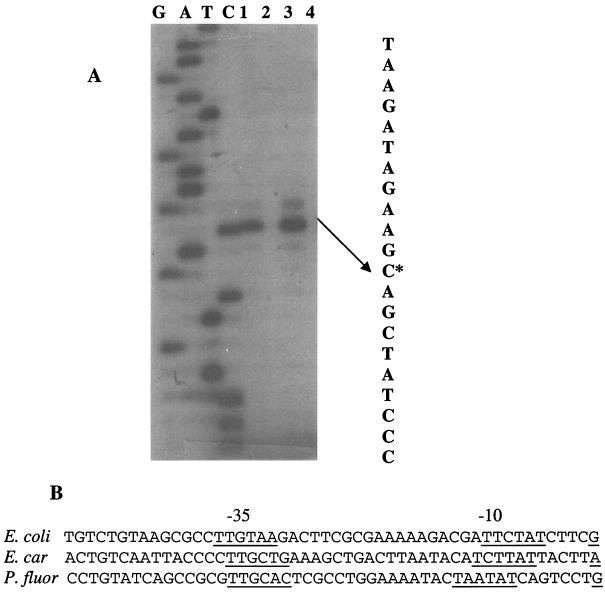
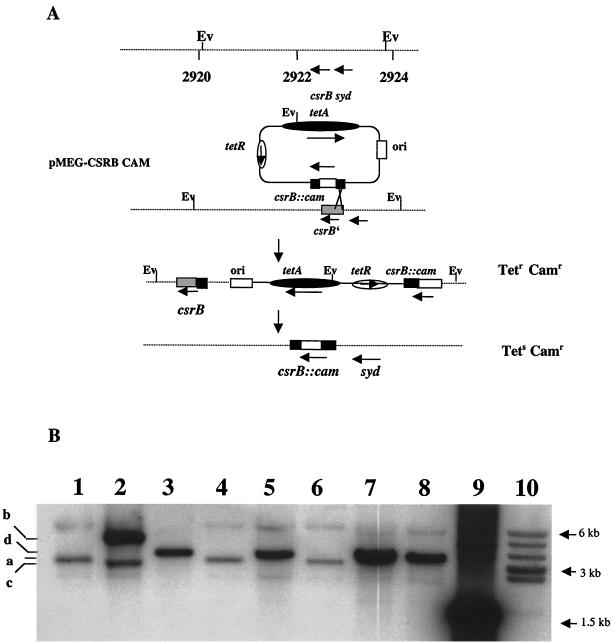
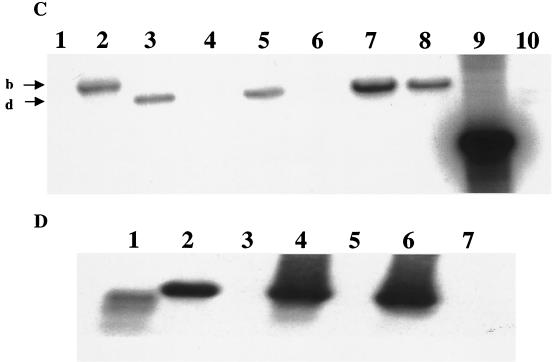
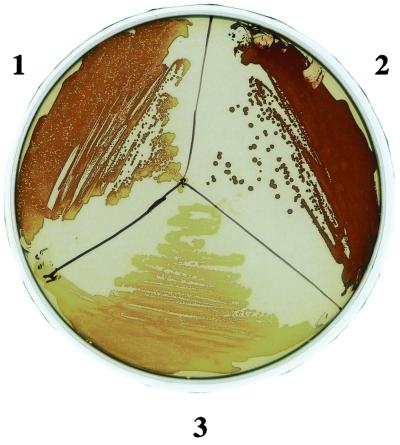
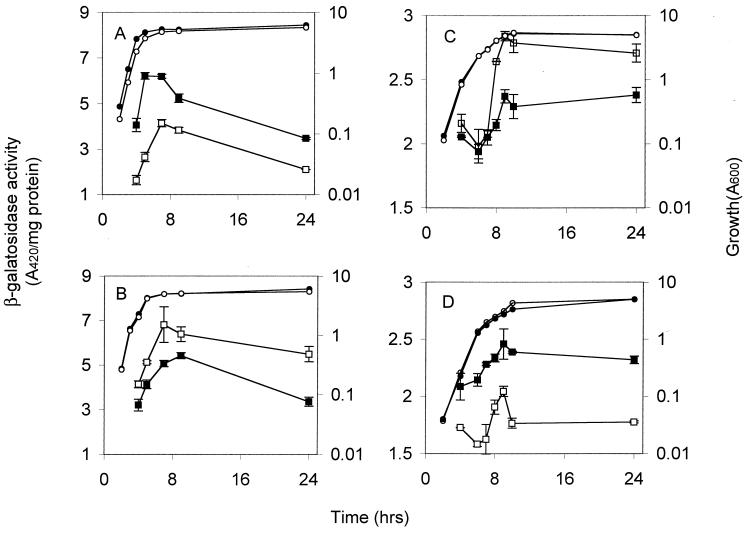
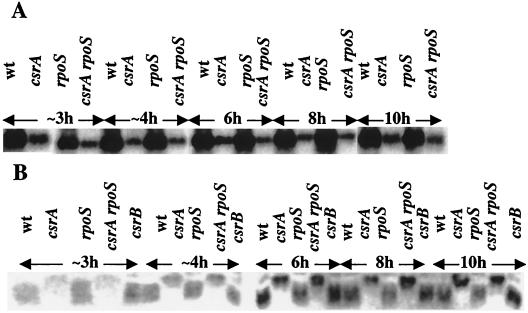
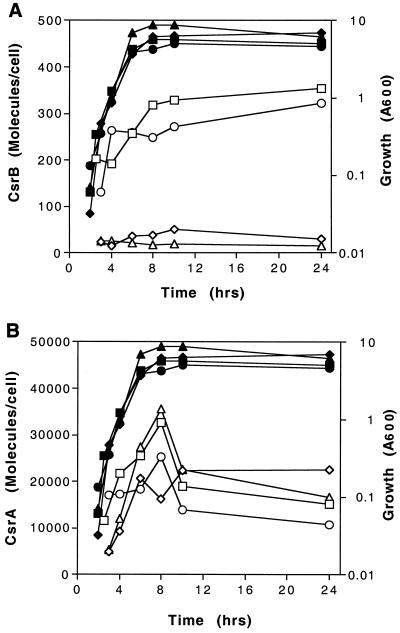
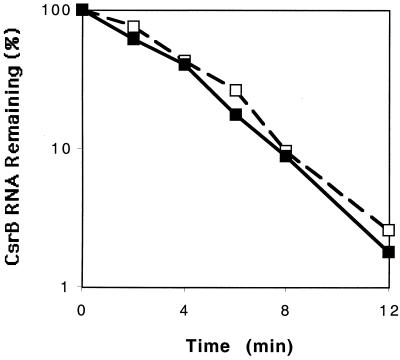
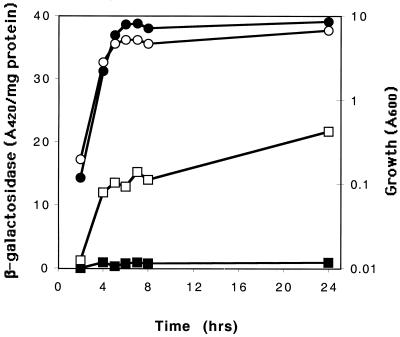
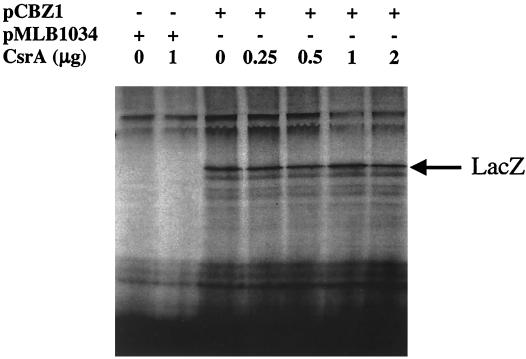
The global regulator CsrA (carbon storage regulator) of Escherichia coli is a small RNA binding protein that represses various metabolic pathways and processes that are induced in the stationary phase of growth, while it activates certain exponential phase functions. Both repression and activation by CsrA involve posttranscriptional mechanisms, in which CsrA binding to mRNA leads to decreased or increased transcript stability, respectively. CsrA also binds to a small untranslated RNA, CsrB, forming a ribonucleoprotein complex, which antagonizes CsrA activity. We have further examined the regulatory interactions of CsrA and CsrB RNA. The 5' end of the CsrB transcript was mapped, and a csrB::cam null mutant was constructed. CsrA protein and CsrB RNA levels were estimated throughout the growth curves of wild-type and isogenic csrA, csrB, rpoS, or csrA rpoS mutant strains. CsrA levels exhibited modest or negligible effects of these mutations. The intracellular concentration of CsrA exceeded the total CsrA-binding capacity of intracellular CsrB RNA. In contrast, CsrB levels were drastically decreased (~10-fold) in the csrA mutants. CsrB transcript stability was unaffected by csrA. The expression of a csrB-lacZ transcriptional fusion containing the region from -242 to +4 bp of the csrB gene was decreased ~20-fold by a csrA::kanR mutation in vivo but was unaffected by CsrA protein in vitro. These results reveal a significant, though most likely indirect, role for CsrA in regulating csrB transcription. Furthermore, our findings suggest that CsrA mediates an intriguing form of autoregulation, whereby its activity, but not its levels, is modulated through effects on an RNA antagonist, CsrB.


Figures

FIG. 1
FIG. 1
Primer extension analysis of CsrB RNA. Reactions were conducted as described in Materials and Methods. (A) Lanes 1 through 4 show extension products from RNA isolated at the transition to stationary phase of growth from MG1655 and isogenic csrA, rpoS, or csrA rpoS mutants, respectively. The transcript initiation site is indicated by an asterisk. (B) Comparison of the apparent csrB promoter sequence with those of the homologue (rsmB) from E. carotovora (E. car.), a putative homologue from P. fluorescens (P. fluor.), and with the E.ς70 promoter consensus elements of E. coli.
FIG. 2
FIG. 2
Construction and characterization of a csrB null mutant. (A) Schematic representation of the strategy used for the replacement of the RNA-coding region of csrB, as described in Materials and Methods. Depicted are the chromosomal location of csrB, including the adjacent EcoRV (Ev) sites, the composition of the integration vector pMEG-CSRB-CAM, the structure of the integrant, and the final allelic replacement. Map coordinates are in kilobases (34). (B) Southern hybridization of csrB. Depicted are EcoRV-digested chromosomal DNA from the parental strain BW3414 (lane 1), the integrant RG-I9 BW3414 (lane 2), the first allelic replacement mutant RG1-B BW3414 (csrB::cam) (lane 3), MG1655 (lane 4), RG1-B MG1655 (csrB::cam) (lane 5), CAG 12079 (lane 6), RG1-B CAG12079-1 (csrB::cam) (lane 7), and RG1-B CAG 12079-2 (csrB::cam) (lane 8). Lanes 9 and 10 depict a csrB::cam-containing 1.5-kb BamHI-KpnI restriction fragment from pMEG-CSRB-CAM hybridized to the same probe and a prelabeled 1-kb DNA ladder, respectively. The identities of the hybridizing EcoRV restriction fragments from the csrB region of the parental strains (a), the integrant RGI-9 BW3414 (b and c), and the csrB::cam mutants (d) are indicated. (C) Reprobing of the chromosomal DNA. The blot shown in panel B was stripped and reprobed with a randomly labeled 0.88-kb cam marker from pMAK705. Note that DNA from parent strains fails to hybridize and that the fragments which hybridize to the cam probe are identical to fragments b and d of panel B. (D) Northern blot using a csrB riboprobe. Depicted are isolated csrB RNA (lane 1), total RNA from strains BW3414 (lane 2), RG1-B BW3414 (csrB::cam) (lane 3), MG1655 (lane 4), RG1-B MG1655 (csrB::cam) (lane 5), CAG12079 (lane 6), and RG1-B CAG12079-1 (csrB::cam) (lane 7).
FIG. 2
FIG. 2
Construction and characterization of a csrB null mutant. (A) Schematic representation of the strategy used for the replacement of the RNA-coding region of csrB, as described in Materials and Methods. Depicted are the chromosomal location of csrB, including the adjacent EcoRV (Ev) sites, the composition of the integration vector pMEG-CSRB-CAM, the structure of the integrant, and the final allelic replacement. Map coordinates are in kilobases (34). (B) Southern hybridization of csrB. Depicted are EcoRV-digested chromosomal DNA from the parental strain BW3414 (lane 1), the integrant RG-I9 BW3414 (lane 2), the first allelic replacement mutant RG1-B BW3414 (csrB::cam) (lane 3), MG1655 (lane 4), RG1-B MG1655 (csrB::cam) (lane 5), CAG 12079 (lane 6), RG1-B CAG12079-1 (csrB::cam) (lane 7), and RG1-B CAG 12079-2 (csrB::cam) (lane 8). Lanes 9 and 10 depict a csrB::cam-containing 1.5-kb BamHI-KpnI restriction fragment from pMEG-CSRB-CAM hybridized to the same probe and a prelabeled 1-kb DNA ladder, respectively. The identities of the hybridizing EcoRV restriction fragments from the csrB region of the parental strains (a), the integrant RGI-9 BW3414 (b and c), and the csrB::cam mutants (d) are indicated. (C) Reprobing of the chromosomal DNA. The blot shown in panel B was stripped and reprobed with a randomly labeled 0.88-kb cam marker from pMAK705. Note that DNA from parent strains fails to hybridize and that the fragments which hybridize to the cam probe are identical to fragments b and d of panel B. (D) Northern blot using a csrB riboprobe. Depicted are isolated csrB RNA (lane 1), total RNA from strains BW3414 (lane 2), RG1-B BW3414 (csrB::cam) (lane 3), MG1655 (lane 4), RG1-B MG1655 (csrB::cam) (lane 5), CAG12079 (lane 6), and RG1-B CAG12079-1 (csrB::cam) (lane 7).
FIG. 3
FIG. 3
Glycogen phenotypes of csrA and csrB mutants. Cultures of MG1655 (section 1), TR1-5MG1655 (csrA::kanR) (section 2), and RG1-B MG1655 (csrB::cam) (section 3) were streaked and grown overnight on Kornberg medium containing 1% glucose and stained with iodine vapor.
FIG. 4
FIG. 4
Effects of the csrB null mutation and csrB overexpression on the expression of chromosomally encoded glgA′-′lacZ and flhDC′-′lacZ translational fusions. β-Galactosidase activities expressed from glgA′-′lacZ in strains KSGA18 (▪) and RGKSGA18 (csrB::cam) (□) (A) and in strains KSGA18[pUC18] (▪) and KSGA18[pCsrB-SF] (□) (B) are shown. β-Galactosidase activities from flhDC′-′lacZ in strains FDBW3414 (▪) and RGFDBW3414 (csrB::cam) (□) (C) and in strains FDBW3414[pBR322] (▪) and FDBW3414[pBR-CSRB1] (□) (D) are shown. In each panel, growth (A600) of the respective strains is depicted by open or shaded circles. Error bars depict the standard deviations of triplicate reactions conducted on a single culture at each time point. This experiment was repeated in its entirety, with essentially identical results.
FIG. 5
FIG. 5
Northern and Western analyses of CsrB RNA and CsrA protein. Strains were grown in Kornberg medium and harvested through the growth curve at the times indicated. (A) A CsrB-specific riboprobe was used to detect CsrB RNA from MG1655 and isogenic csrA, rpoS, and csrA rpoS mutants. (B) Western analysis was used to detect CsrA protein from MG1655 and csrA, rpoS, csrA rpoS, and csrB mutants. Both the Northern and Western blot results were obtained by phosphorimage analysis. Note that the ∼3- and ∼4-h samples of each strain were actually harvested when cultures had reached 0.3 and 1.0 A600, respectively.
FIG. 6
FIG. 6
Cellular concentrations of CsrB RNA (A) and CsrA protein (B) during growth. Cultures were grown in Kornberg medium containing 0.5% glucose, and CsrB RNA and CsrA protein were quantified by Northern or Western blotting, respectively, as described in Materials and Methods. The symbols represent MG1655 (□) and its isogenic mutants defective in csrA (⧫), rpoS (○), csrA rpoS (▵), and csrB (▿). Open and closed symbols represent molecules and growth (A600), respectively. The number of molecules per cell was calculated assuming 5.85 × 10⁻¹⁴ g of RNA and 1.56 × 10⁻¹³ g of total protein per cell (29) and using the molecular masses of 6,857 Da for CsrA protein and 126,845 Da for CsrB RNA.
FIG. 7
FIG. 7
Chemical decay curve of CsrB RNA. Cultures were grown to the transition to stationary phase, rifampin was added, and samples were collected at 0, 2, 4, 6, 8, and 12 min following rifampin addition. CsrB RNA was quantified by Northern hybridization and phosphorimage analysis, as described in Materials and Methods. Values for CsrB RNA in MG1655 (□) or its csrA mutant (⧫) are expressed as percentages of the value at 0 min in the respective strain. A half-life for CsrB of ∼2 min was determined in each strain. This experiment was repeated, with similar results; a half-life of ∼2 min was observed in the csrA wild-type and mutant strains.
FIG. 8
FIG. 8
Effects of csrA on the expression of a csrB-lacZ transcriptional fusion. Strains KSB837(csrB-lacZ) and TR1-5KSB837(csrB-lacZ csrA::kanR) were grown in Kornberg medium containing 0.5% glucose. Specific β-galactosidase activities for KSB837 and TR1-5KSB837 are shown as open and filled squares, respectively. Growth (A600) of these two strains is shown as open and filled circles, respectively. The data shown depict the averages of results from duplicate assays on a single culture at each time point. This experiment was repeated in its entirety with essentially identical results; specific β-galactosidase activity was ∼20-fold higher in the csrA wild-type strain.
FIG. 9
FIG. 9
In vitro transcription-translation of the csrB-lacZ transcriptional fusion of pCBZ1. Reaction mixtures (35 μl) contained 2 μg of the cloning vector, pMLB1034, or pCBZ1 plasmid DNA and were conducted in the absence or presence of CsrA protein (provided as the CsrA-CsrB complex), as indicated, in an S-30 extract prepared from TR1-5BW3414 (csrA::kanR). One microgram of CsrA protein is equivalent to 0.15 nmol of the monomer. The position of β-galactosidase (LacZ) was identified using an unlabeled protein standard.

Similar articles

Cited by

References

    1. Altier C, Suyemoto M, Lawhon S D. Regulation of Salmonella enterica serovar Typhimurium invasion genes by csrA. Infect Immun. 2000;68:6790–6797. - PMC - PubMed
    1. Altier C, Suyemoto M, Ruiz A I, Burnham K D, Maurer R. Characterization of two novel regulatory genes affecting Salmonella invasion gene expression. Mol Microbiol. 2000;35:635–646. - PubMed
    1. Ausubel F M, Brent R, Kingston R E, Moore D D, Seidman J G, Smith J A, Struhl K, editors. Current protocols in molecular biology. New York, N.Y: John Wiley & Sons; 1989.
    1. Azam T A, Iwata A, Nishimura A, Ueda S, Ishihama A. Growth phase-dependent variation in protein composition of the Escherichia coli nucleoid. J Bacteriol. 1999;181:6361–6370. - PMC - PubMed
    1. Babitzke P. Regulation of tryptophan biosynthesis: Trp-ing the TRAP or how Bacillus subtilis reinvented the wheel. Mol Microbiol. 1997;26:1–9. - PubMed

Publication types

LinkOut - more resources