. 2001 Oct 1;21(19):7463-73.
doi: 10.1523/JNEUROSCI.21-19-07463.2001.

The brain metabolite kynurenic acid inhibits alpha7 nicotinic receptor activity and increases non-alpha7 nicotinic receptor expression: physiopathological implications

Affiliations

The brain metabolite kynurenic acid inhibits alpha7 nicotinic receptor activity and increases non-alpha7 nicotinic receptor expression: physiopathological implications

C Hilmas et al. J Neurosci. .

Abstract

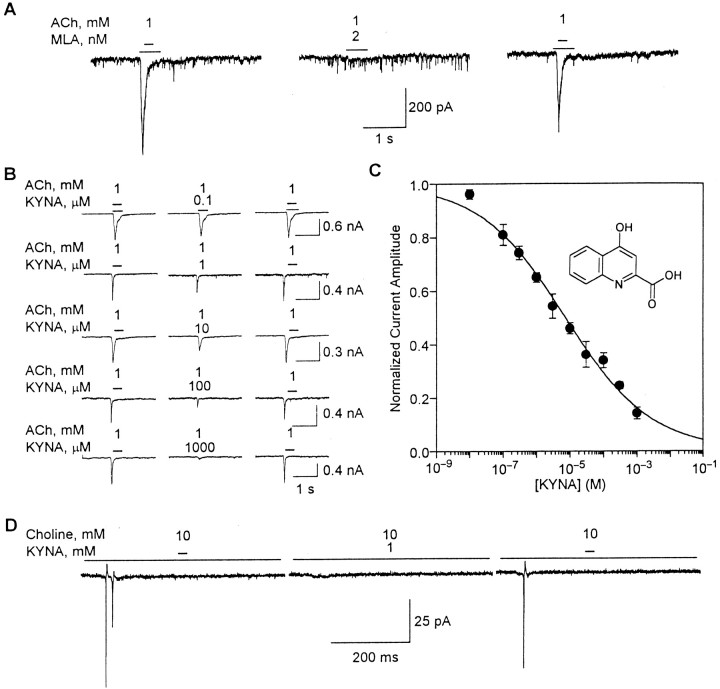
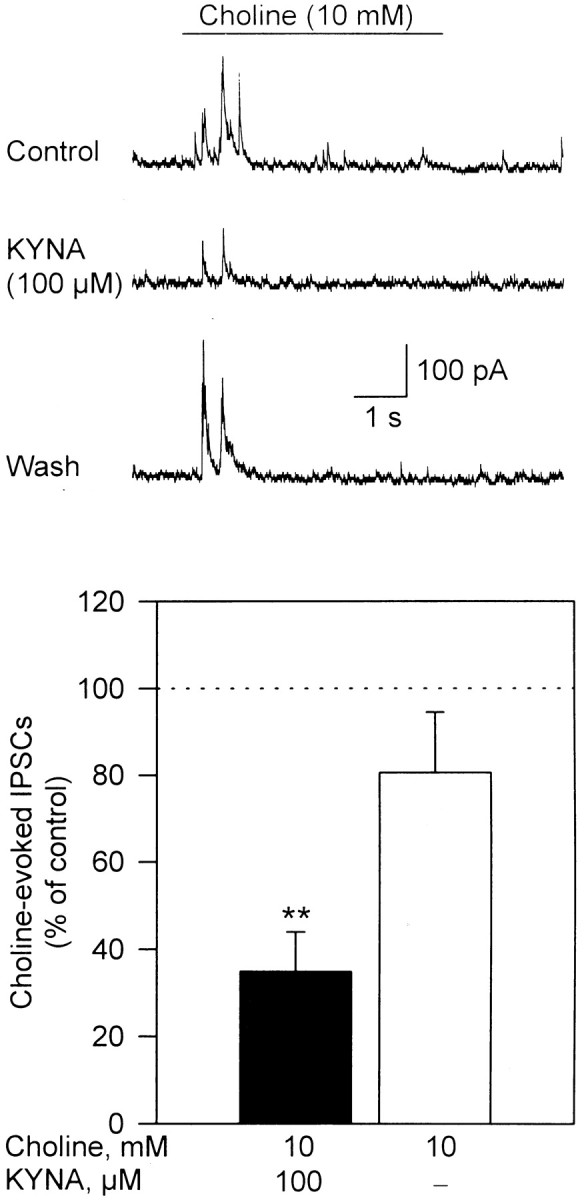
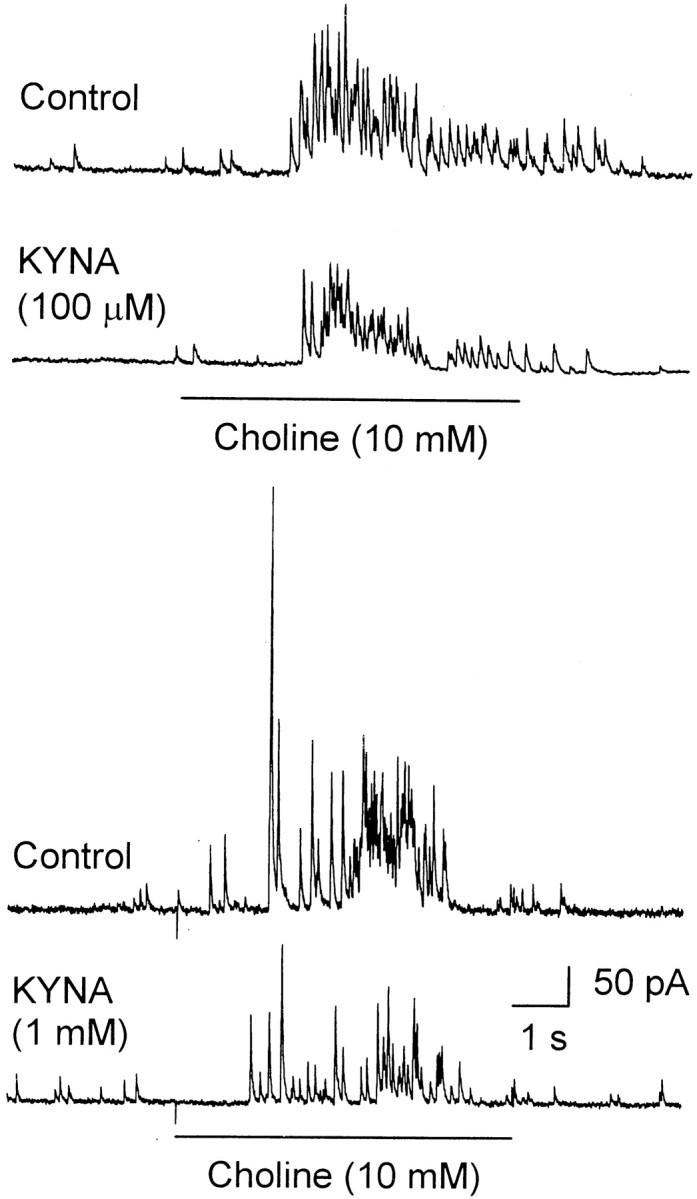
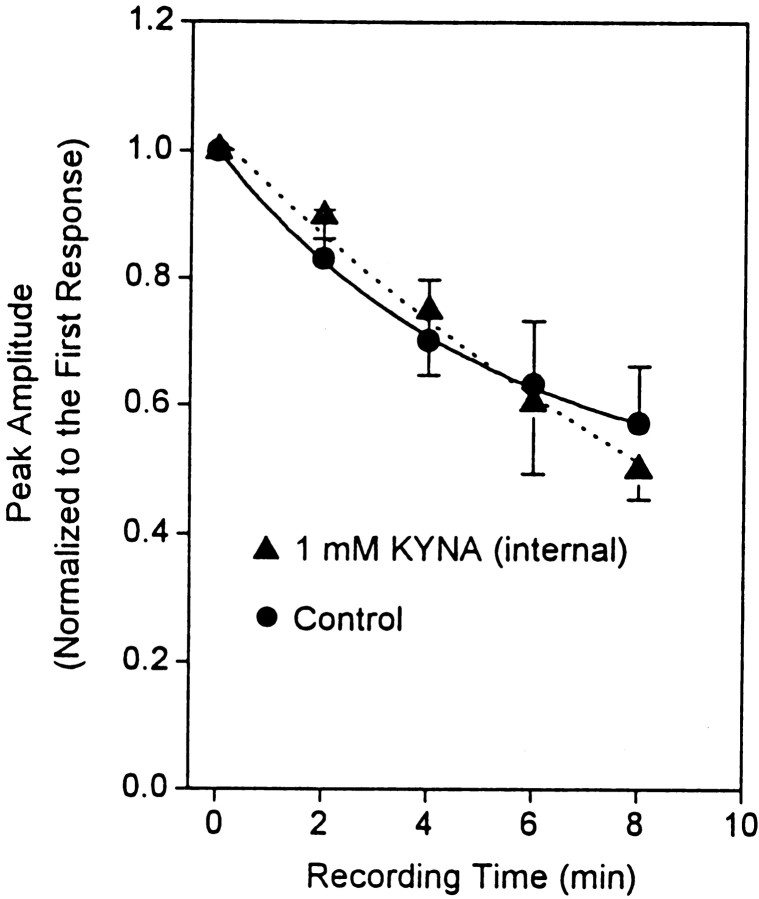
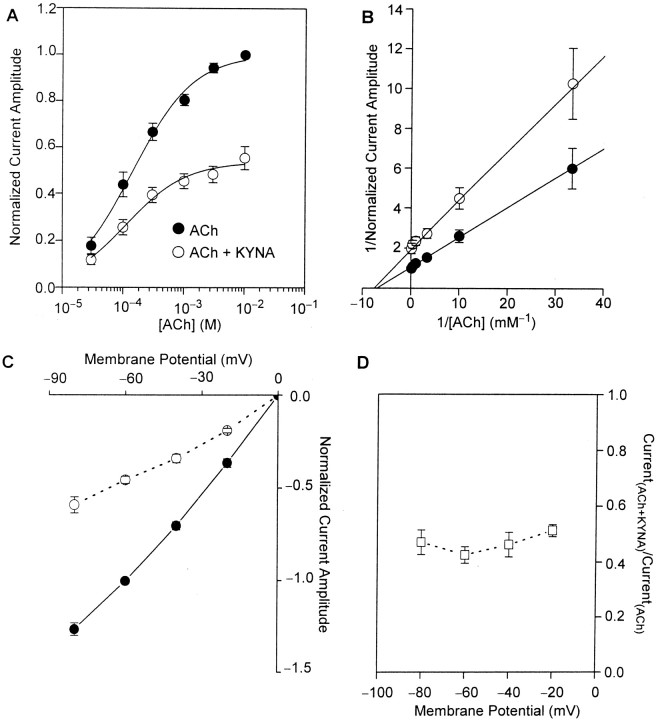
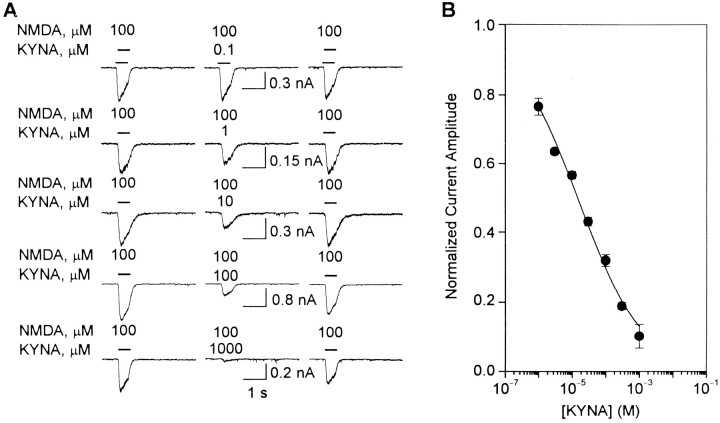
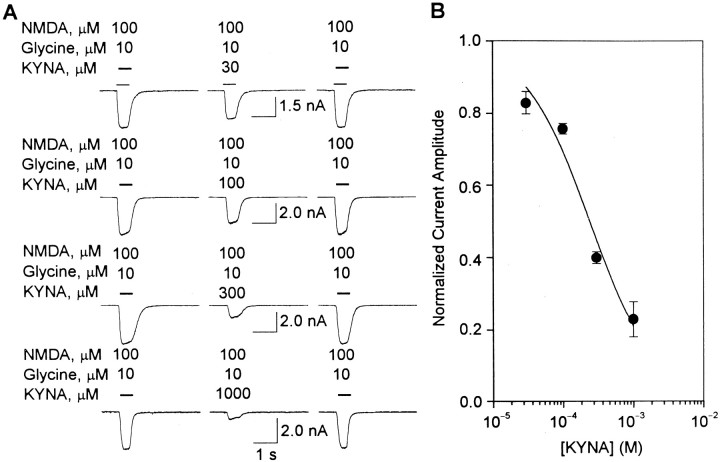
The tryptophan metabolite kynurenic acid (KYNA) has long been recognized as an NMDA receptor antagonist. Here, interactions between KYNA and the nicotinic system in the brain were investigated using the patch-clamp technique and HPLC. In the electrophysiological studies, agonists were delivered via a U-shaped tube, and KYNA was applied in admixture with agonists and via the background perfusion. Exposure (>/=4 min) of cultured hippocampal neurons to KYNA (>/=100 nm) inhibited activation of somatodendritic alpha7 nAChRs; the IC(50) for KYNA was approximately 7 microm. The inhibition of alpha7 nAChRs was noncompetitive with respect to the agonist and voltage independent. The slow onset of this effect could not be accounted for by an intracellular action because KYNA (1 mm) in the pipette solution had no effect on alpha7 nAChR activity. KYNA also blocked the activity of preterminal/presynaptic alpha7 nAChRs in hippocampal neurons in cultures and in slices. NMDA receptors were less sensitive than alpha7 nAChRs to KYNA. The IC(50) values for KYNA-induced blockade of NMDA receptors in the absence and presence of glycine (10 microm) were approximately 15 and 235 microm, respectively. Prolonged (3 d) exposure of cultured hippocampal neurons to KYNA increased their nicotinic sensitivity, apparently by enhancing alpha4beta2 nAChR expression. Furthermore, as determined by HPLC with fluorescence detection, repeated systemic treatment of rats with nicotine caused a transient reduction followed by an increase in brain KYNA levels. These results demonstrate that nAChRs are targets for KYNA and suggest a functionally significant cross talk between the nicotinic cholinergic system and the kynurenine pathway in the brain.


Figures

Fig. 1.
Fig. 1.
KYNA-induced blockade of type IA currents in cultured hippocampal neurons. A, Fast desensitizing currents that were evoked by U-tube application of ACh to cultured hippocampal neurons were blocked after 10 min perfusion of the neurons with MLA (2 nm)-containing external solution. The effect of MLA was fully reversible after 15 min washing of the neurons.B, Sample recordings of ACh-evoked type IA currents obtained from hippocampal neurons before their exposure to KYNA (left traces), after 4–10 min perfusion with KYNA-containing external solution (middle traces), and after 10 min washing with KYNA-free external solution (right traces). Different neurons were exposed to each KYNA concentration. C, Concentration–response relationship for KYNA-induced blockade of ACh (1 mm)-evoked type IA currents. The rundown-corrected amplitude of type IA currents (see Materials and Methods) was taken as 1 and used to normalize the amplitude of type IA currents evoked by ACh in the presence of KYNA (0.1 μm to 1 mm). Each point and bar represent mean and SEM, respectively, of results obtained from 5–18 neurons. All experiments were performed in neurons perfused continuously with external solution containing atropine (1 μm) and TTX (200 nm). Membrane potential (AC), −60 mV. Inset, Chemical structure of KYNA. D, KYNA-induced blockade of choline-evoked action potentials recorded from a cultured hippocampal neuron under cell-attached configuration. U-tube application of the α7 nAChR agonist choline (10 mm) to the neuron evoked action potentials (left trace). The response induced by choline was blocked by 4–6 min exposure of the neuron to KYNA (1 mm; middle trace). The effect of KYNA was reversed after 10 min washing of the neuron with external solution (right trace). Recordings were obtained in the presence of atropine (1 μm), picrotoxin (100 μm), CNQX (10 μm), and APV (50 μm). Pipette potential, −60 mV.
Fig. 2.
Fig. 2.
KYNA-induced blockade of IPSCs evoked by choline in cultured hippocampal neurons. Sample recordings of choline (10 mm)-evoked IPSCs obtained before (Control), after 10 min perfusion of the hippocampal neurons with external solution containing KYNA (100 μm), and after 20 min washing of the neuron with external solution (Wash) are shown. Recordings were obtained in the presence of atropine (1 μm), CNQX (10 μm), and APV (50 μm). Membrane potential, +40 mV. Graph shows quantification of the effect of KYNA on choline-triggered IPSCs. Total charge carried by IPSCs triggered by choline was estimated by the area under the curve during the 5 sec pulse application of choline. The total charge of choline-evoked IPSCs recorded before exposure of the neurons to KYNA was taken as 100% and used to normalize the responses recorded in the presence of KYNA and after washing of the neurons. Each graph bar and error bar represent mean and SEM, respectively, of results obtained from three neurons. **p < 0.01 (paired Student'st test).
Fig. 3.
Fig. 3.
KYNA-induced blockade of choline-evoked IPSCs recorded from CA1 interneurons in rat hippocampal slices. Representative sample traces of choline (10 mm)-evoked GABAergic PSCs recorded before (Control) and after 25 min perfusion of the slices with ACSF containing KYNA (100 μm or 1 mm) are shown. Pairs of traces shown in the top and bottom panels were obtained from different neurons. Recordings were obtained in the presence of atropine (1 μm), CNQX (10 μm), and APV (50 μm). Methanesulfonate-based internal solution was used to fill the patch pipettes (see Materials and Methods). Membrane potential, 0 mV.
Fig. 4.
Fig. 4.
KYNA applied intracellularly has no effect on ACh-evoked type IA currents. Rundown of the peak amplitude of ACh (1 mm)-evoked type IA currents recorded from cultured hippocampal neurons using pipette solution without (Control) or with KYNA (1 mm) is shown. The amplitude of the currents evoked by the first ACh pulse in each neuron was taken as 1 and used to normalize the amplitude of currents recorded subsequently from that same neuron. Each symbol and bar represent mean and SEM, respectively, of results obtained from 54 neurons in the control group and 4 neurons in the test group. All recordings were obtained in the presence of TTX (200 nm) and atropine (1 μm). Membrane potential, −60 mV.
Fig. 5.
Fig. 5.
KYNA-induced blockade of α7 nAChRs is noncompetitive and voltage independent. A, Semi-logarithmic plot of the concentration–response relationships for ACh in evoking type IA currents in cultured hippocampal neurons in the absence and presence of KYNA. Under the control condition, ACh (1 sec pulses; 30 μm to 10 mm) was applied to cultured hippocampal neurons. Rundown-corrected amplitudes of currents evoked by 10 mm ACh were taken as 1 and used to normalize the amplitudes of currents evoked by other ACh concentrations. In another set of experiments, after the control responses evoked by a given concentration of ACh were recorded, neurons were exposed for 4–8 min to KYNA (30 μm) and tested for their responsiveness to pulses of ACh plus KYNA. Rundown-corrected amplitudes of currents evoked by a given ACh concentration under control condition were then taken as 1 and used to normalize the amplitudes of currents evoked by ACh in the presence of KYNA. Membrane potential, −60 mV.B, Double-reciprocal plots of the concentration–response relationships for ACh in evoking type IA currents in the absence and presence of KYNA (30 μm). Each symbol and bar represent mean and SEM, respectively, of results obtained from 3–11 neurons. In some cases, error bars are not seen because they are smaller than the symbol size. C, Current–voltage relationships for responses evoked by ACh (1 mm) in the absence (●) or presence of KYNA (30 μm; ○). Under the control condition, rundown-corrected amplitudes of ACh (1 mm)-evoked currents recorded from neurons voltage clamped at −60 mV were taken as 1 and used to normalize the amplitudes of currents evoked by ACh at all membrane potentials. The plot of the normalized current amplitude versus membrane potential could be fitted by a straight line. The extrapolated reversal potential was ∼0 mV. Rundown-corrected amplitudes of type IA currents evoked by ACh (1 mm) at any membrane potential were taken as 1 and used to normalize the amplitudes of type IA currents evoked by pulses of ACh plus KYNA (30 μm) at that membrane potential. D, Plot of the ratio of the amplitudes of currents evoked by pulses of ACh plus KYNA and the amplitudes of currents evoked by ACh alone versus membrane potential. Each symbol and bar represent mean and SEM, respectively, of results obtained from three neurons. All experiments were performed in the presence of TTX (200 nm) and atropine (1 μm).
Fig. 6.
Fig. 6.
KYNA-induced blockade of whole-cell currents evoked by NMDA in cultured hippocampal neurons. A,Traces are sample recordings of currents evoked by NMDA (100 μm) under control conditions (left traces), in the presence of KYNA (0.1 μm to 1 mm) after 4 min perfusion of the neurons with external solution containing KYNA (middle traces), and after 10 min washing of the neurons with KYNA-free external solution (right traces). B, Graph is the semi-logarithmic plot of the concentration-dependent inhibition of NMDA-evoked currents by KYNA. The amplitudes of currents evoked by NMDA under control condition were taken as 1 and used to normalize the amplitudes of currents recorded in the presence of KYNA. Each point and bar represent mean and SEM, respectively, of results obtained from 3–10 experiments. All recordings were obtained in the presence of TTX (200 nm). Membrane potential, −60 mV.
Fig. 7.
Fig. 7.
KYNA-induced blockade of whole-cell currents evoked by NMDA-plus-glycine in cultured hippocampal neurons.A, Traces are sample recordings of whole-cell currents evoked by NMDA (100 μm)-plus-glycine (10 μm) under control conditions (left traces), in the presence of KYNA (30 μm to 1 mm) after 4 min perfusion of the neurons with external solution containing KYNA (middle traces), and after 10 min washing of the neurons with KYNA-free external solution (right traces). B, Graph is semi-logarithmic plot of the concentration-dependent effect of KYNA on whole-cell current evoked by NMDA-plus-glycine. The amplitudes of currents evoked by NMDA-plus-glycine under control condition were taken as 1 and used to normalize the amplitudes of currents recorded in the presence of KYNA. Each point and bar represent mean and SEM, respectively, of results obtained from four to seven experiments. All recordings were obtained in the presence of TTX (200 nm). Membrane potential, −60 mV.

References

    1. Albuquerque EX, Alkondon M, Pereira EFR, Castro NG, Schrattenholz A, Barbosa CTF, Bonfante-Cabarcas R, Aracava Y, Eisenberg HM, Maelicke A. Properties of neuronal nicotinic acetylcholine receptors: pharmacological characterization and modulation of synaptic function. J Pharmacol Exp Ther. 1997;280:1117–1136. - PubMed
    1. Alkondon M, Albuquerque EX. Diversity of nicotinic acetylcholine receptors in rat hippocampal neurons. I. Pharmacological and functional evidence for distinct structural subtypes. J Pharmacol Exp Ther. 1993;265:1455–1473. - PubMed
    1. Alkondon M, Pereira EFR, Eisenberg HM, Albuquerque EX. Choline and selective antagonists identify two subtypes of nicotinic acetylcholine receptors that modulate GABA release from CA1 interneurons in rat hippocampal slices. J Neurosci. 1999;19:2693–2705. - PMC - PubMed
    1. Alkondon M, Pereira EFR, Almeida LEF, Randall WR, Albuquerque EX. Nicotine at concentrations found in cigarette smokers activates and desensitizes nicotinic acetylcholine receptors in CA1 interneurons of rat hippocampus. Neuropharmacology. 2000;39:2726–2739. - PubMed
    1. Almeida LEF, Pereira EFR, Alkondon M, Fawcett WP, Randall WR, Albuquerque EX. The opioid antagonist naltrexone inhibits activity and alters expression of α7 and α4β2 nicotinic receptors: implications for smoking cessation programs. Neuropharmacology. 2000;39:2740–2755. - PubMed

Publication types

MeSH terms

LinkOut - more resources