Multistep nucleus formation and a separate subunit contribution of the amyloidgenesis of heat-denatured monellin
- PMID: 11567100
- PMCID: PMC2374219
- DOI: 10.1110/ps.20201
Multistep nucleus formation and a separate subunit contribution of the amyloidgenesis of heat-denatured monellin
Abstract
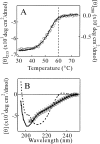
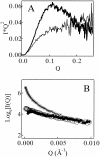
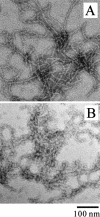
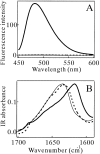
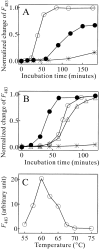
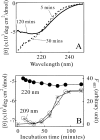
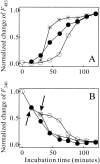
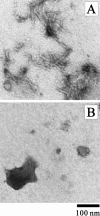
Monellin (MN) is a sweet-tasting plant protein known to form fibrous aggregates in the heat-denatured state. Here the amyloid-type aggregation process of MN is extensively characterized. The amyloidgenesis was initiated in a highly denatured state of MN. A seeding effect of skipping a lag phase of the amyloid formation kinetics established a nucleation-dependent aggregation mechanism. A finely controlled experimental protocol revealed an additional prenucleus stage preceding the maturation of the nucleus, indicating that the initial lag phase is composed of multiple conformational events. The results obtained for the aggregation properties of the separate A and B subunit chains of MN and a recombinant single-chain MN suggest that the B chain exclusively contributed to the amyloid-type aggregation. These findings suggest a scheme for the amyloidgenesis of MN and their subunits, and provide a unique model of amyloidgenesis that is regulated by the subunit composition of protein.
Figures



Similar articles
-
Amyloid fibril formation by the chain B subunit of monellin occurs by a nucleation-dependent polymerization mechanism.Biochemistry. 2014 Feb 25;53(7):1206-17. doi: 10.1021/bi401467p. Epub 2014 Feb 13. Biochemistry. 2014. PMID: 24495141
-
Dependence on solution conditions of aggregation and amyloid formation by an SH3 domain.J Mol Biol. 2001 Aug 10;311(2):325-40. doi: 10.1006/jmbi.2001.4858. J Mol Biol. 2001. PMID: 11478864
-
Amyloid-like aggregates of a plant protein: a case of a sweet-tasting protein, monellin.FEBS Lett. 1999 Jul 2;454(1-2):122-6. doi: 10.1016/s0014-5793(99)00789-9. FEBS Lett. 1999. PMID: 10413108
-
[Amyloidosis: a model of misfolded protein disorder].Med Sci (Paris). 2005 Jun-Jul;21(6-7):627-33. doi: 10.1051/medsci/2005216-7627. Med Sci (Paris). 2005. PMID: 15985206 Review. French.
-
Protein denaturation and aggregation: Cellular responses to denatured and aggregated proteins.Ann N Y Acad Sci. 2005 Dec;1066:181-221. doi: 10.1196/annals.1363.030. Ann N Y Acad Sci. 2005. PMID: 16533927 Review.
Cited by
-
Charge dependent retardation of amyloid β aggregation by hydrophilic proteins.ACS Chem Neurosci. 2014 Apr 16;5(4):266-74. doi: 10.1021/cn400124r. Epub 2014 Feb 6. ACS Chem Neurosci. 2014. PMID: 24475785 Free PMC article.
-
Dehydration of main-chain amides in the final folding step of single-chain monellin revealed by time-resolved infrared spectroscopy.Proc Natl Acad Sci U S A. 2008 Sep 9;105(36):13391-6. doi: 10.1073/pnas.0801316105. Epub 2008 Aug 29. Proc Natl Acad Sci U S A. 2008. PMID: 18757727 Free PMC article.
-
Identification of subfunctionalized aggregate-remodeling J-domain proteins in Arabidopsis thaliana.J Exp Bot. 2023 Mar 13;74(5):1705-1722. doi: 10.1093/jxb/erac514. J Exp Bot. 2023. PMID: 36576197 Free PMC article.
-
Ionic self-complementarity induces amyloid-like fibril formation in an isolated domain of a plant copper metallochaperone protein.BMC Struct Biol. 2004 Jun 4;4:7. doi: 10.1186/1472-6807-4-7. BMC Struct Biol. 2004. PMID: 15180901 Free PMC article.
-
Structure based aggregation studies reveal the presence of helix-rich intermediate during α-Synuclein aggregation.Sci Rep. 2015 Mar 18;5:9228. doi: 10.1038/srep09228. Sci Rep. 2015. PMID: 25784353 Free PMC article.
References
-
- Bjellqvist, B., Hughes, G.J., Pasquali, C., Paquet, N., Ravier, F., Sanchez, J.C., Frutiger, S., and Hochstrasser, D. 1993. The focusing positions of polypeptides in immobilized pH gradients can be predicted from their amino acid sequences. Electrophoresis 14 1023–1031. - PubMed
-
- Dobson, C.M. and Karplus, M. 1999. The fundamentals of protein folding: Bringing together theory and experiment. Curr. Opin. Struct. Biol. 9 92–101. - PubMed
-
- Fan, P., Bracken, C., and Baum, J. 1993. Structural characterization of monellin in the alcohol-denatured state by NMR: Evidence for β-sheet to α-helix conversion. Biochemistry 32 1573–1582. - PubMed
MeSH terms
Substances
LinkOut - more resources
Full Text Sources
Medical

