

Review
doi: 10.1128/AEM.67.10.4399-4406.2001.
Counting the uncountable: statistical approaches to estimating microbial diversity
Affiliations
- PMID: 11571135
- PMCID: PMC93182
- DOI: 10.1128/AEM.67.10.4399-4406.2001
Item in Clipboard
Review
Counting the uncountable: statistical approaches to estimating microbial diversity
Appl Environ Microbiol.
2001 Oct.
Erratum in
- Appl Environ Microbiol 2002 Jan;68(1):448
No abstract available
Figures
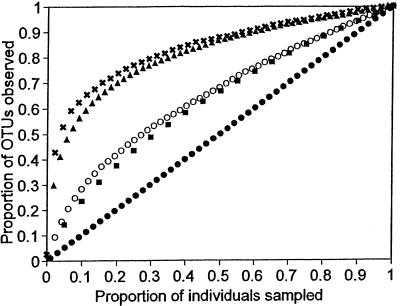
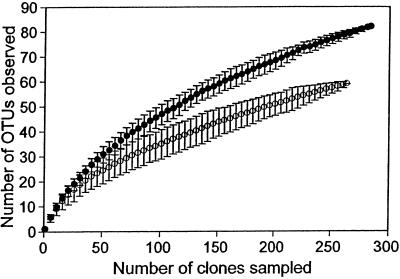
Accumulation curves for Michigan plants (✖; n = 1,783) (26), Costa Rican birds (▴; n = 5,007) (J. B. Hughes, unpublished data), human oral bacteria (○; n = 264) (33), Costa Rican moths (■; n = 4,538) (56), and East Amazonian soil bacteria (●; n = 98) (6). Curves are averaged over 100 simulations using the computer program EstimateS and are standardized for the number of individuals and species observed.
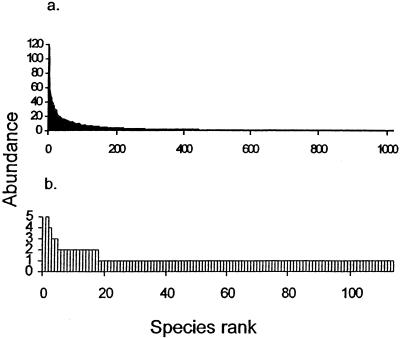
Rank-abundance curves for (a) tropical moths (n = 4,538) (56) and (b) temperate soil bacteria (n = 137) (39). The two most abundant species of moths (396 and 173 individuals) are excluded from panel a to shorten the y axis.

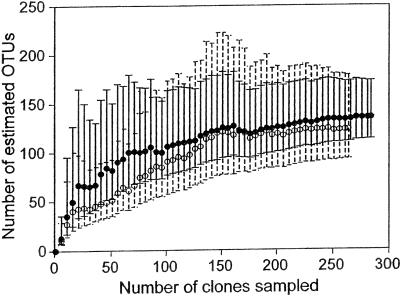
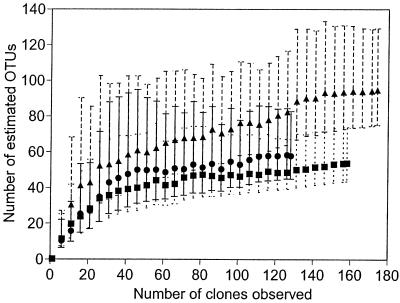
Observed and estimated OTU richness of bacteria in a human mouth (33) versus sample size. The number of OTUs observed for a given sample size, or the accumulation curve, is averaged over 50 simulations (○). Estimated OTU richness is plotted for Chaol (●) and ACE (▴) estimators.
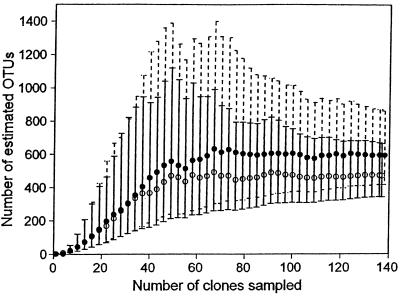
Chaol estimates of human mouth (○) and gut (●) bacterial richness as a function of sample size. Error bars are 95% CIs and were calculated with the variance formula derived by Chao (8). The dashed lines are error bars for the mouth. The solid lines are error bars for the gut.
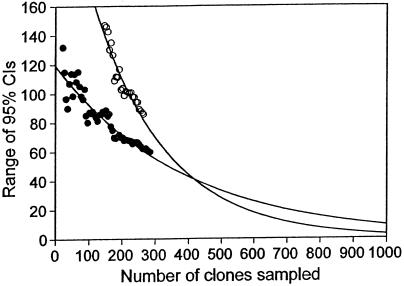
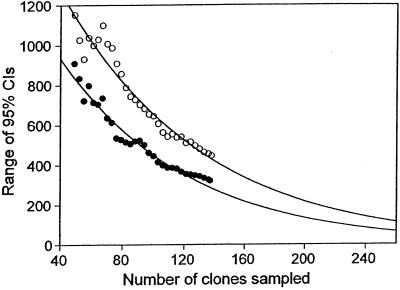
Average size of the 95% CIs of Chaol estimates for bacteria in the human mouth (○) and gut (●) as sample size increases. These CIs are the same as in Fig. 4, but only the decreasing portions of the CIs are plotted. The curves are fitted negative exponential curves [mouth, f(x) = 270e−0.0046x, r2 = 0.90; gut, f(x) = 120e−0.0026x, r2 = 0.87].
Rarefaction curves of observed OTU richness in human mouth (○) and gut (●) bacterial samples. The error bars are 95% CIs and were calculated from the variance of the number of OTUs drawn in 100 randomizations at each sample size.
Chaol estimates of bacterial OTU richness in low- (■), intermediate- (●), and high- (▴) productivity ponds. Error bars are 90% CIs and were calculated with the variance formula derived by Chao (8). The dotted, solid, and dashed bars are error bars for the low-, intermediate-, and high-productivity mesocosms, respectively.
Chaol estimates of bacterial OTU richness in improved (○) and unimproved (●) soil as a function of sample size. Error bars are 95% CIs and were calculated with the variance formula derived by Chao (8). The solid lines are error bars for the improved sample. The dashed lines are error bars for the unimproved sample.
Average size of the 95% CIs of Chaol estimates for the improved (○) and unimproved (●) soil as the number of clones sampled increases. These CIs are the same as in Fig. 8, but only the decreasing portions of the CIs are plotted. The curves are fitted negative exponential curves [improved, f(x) = 1,500e−0.012x, r2 = 0.96; unimproved, f(x) = 2,000e−0.011x, R2 = 0.94].
References
-
- Achenbach L A, Coates J D. Disparity between bacterial phylogeny and physiology. ASM News. 2000;66:714–715.
-
- Baltanas A. On the use of some methods for the estimation of species richness. Oikos. 1992;65:484–492.
-
- Bills G F, Polishook J D. Abundance and diversity of microfungi in leaf-litter of a lowland rain-forest in Costa Rica. Mycologia. 1994;86:187–198.
Publication types
MeSH terms
LinkOut - more resources
Full Text Sources
Other Literature Sources
