Comparative Study
. 2001 Sep 25;98(20):11444-9.
doi: 10.1073/pnas.191389398.

Drought- and salt-tolerant plants result from overexpression of the AVP1 H+-pump

Affiliations
Comparative Study

Drought- and salt-tolerant plants result from overexpression of the AVP1 H+-pump

R A Gaxiola et al. Proc Natl Acad Sci U S A. .

Abstract

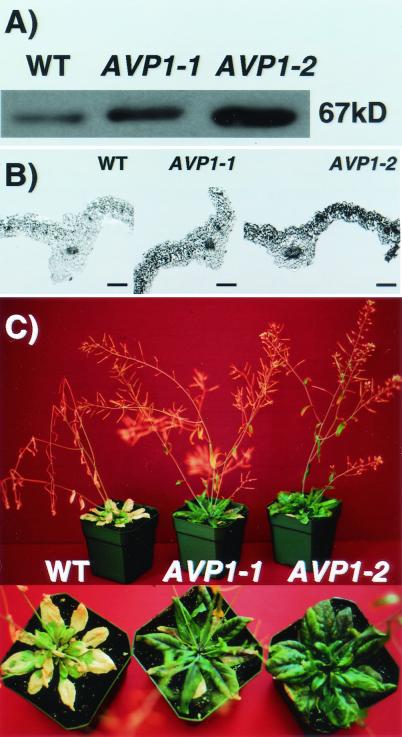
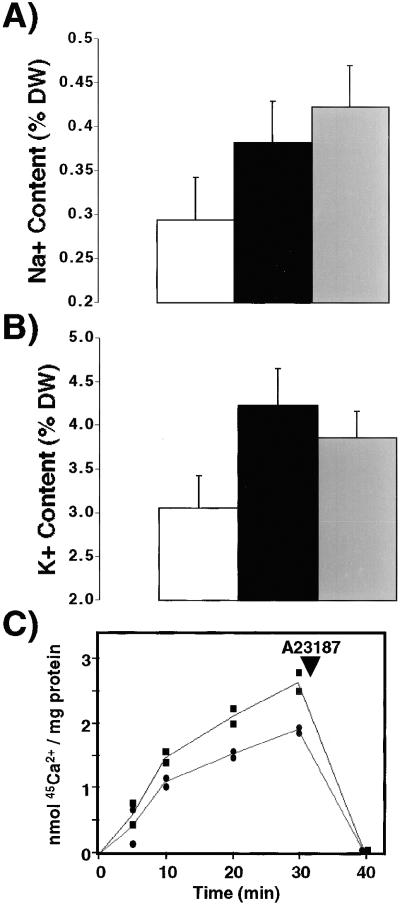
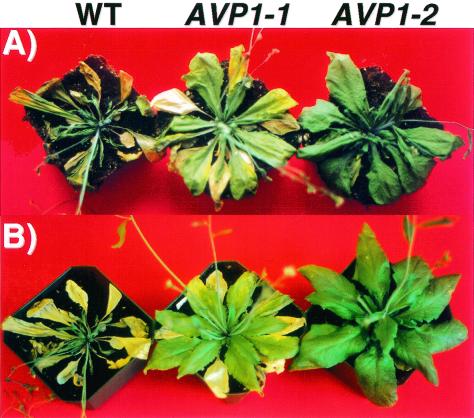
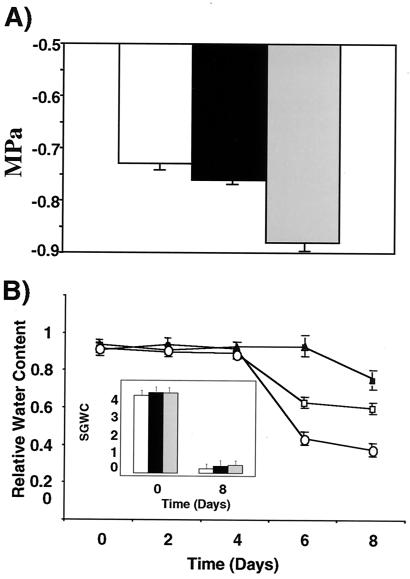
Transgenic plants overexpressing the vacuolar H(+)-pyrophosphatase are much more resistant to high concentrations of NaCl and to water deprivation than the isogenic wild-type strains. These transgenic plants accumulate more Na(+) and K(+) in their leaf tissue than the wild type. Moreover, direct measurements on isolated vacuolar membrane vesicles derived from the AVP1 transgenic plants and from wild type demonstrate that the vesicles from the transgenic plants have enhanced cation uptake. The phenotypes of the AVP1 transgenic plants suggest that increasing the vacuolar proton gradient results in increased solute accumulation and water retention. Presumably, sequestration of cations in the vacuole reduces their toxic effects. Genetically engineered drought- and salt-tolerant plants could provide an avenue to the reclamation of farmlands lost to agriculture because of salinity and a lack of rainfall.


Figures

Figure 1
Figure 1
AVP1 overexpression increases salt tolerance. (A) Western blot of membrane fractions from wild-type and transgenic plants. Protein (10 μg) from total membrane fractions isolated from shoots of four wild-type and four plants of each of the transgenic lines (AVP1-1 and AVP1-2) was separated by 10% SDS/PAGE. Four SDS/PAGE gels were transferred and immunoblotted with antibodies raised against a keyhole limpet hemocyanin-conjugated AVP1 peptide (see Materials and Methods). AVP1 protein was detected by chemiluminescence. The photograph corresponds to one of four immunoblots. WT, wild type. (B) Immunocytochemical localization of AVP1 protein in wild-type, AVP1-1, and AVP1-2 transgenic plants. Sections of rosette leaves were probed with the AVP1 antibody. Antibody binding was detected with NBT/BCIP as substrate (see Materials and Methods). (Bars, 200 μm.) (C) Salt treatment of wild type and two AVP1-overexpressing transgenic lines. Plants were grown on soil in a 16-h light/8-h dark cycle and treated as described in Materials and Methods. The photograph shows plants at the 10th day after treatment with 250 mM NaCl (see Materials and Methods).
Figure 2
Figure 2
Na+ (A) and K+ (B) content from rosette leaves of wild-type and transgenic plants. White bars correspond to wild-type Na+ and K+ values calculated as a percentage of total dry weight (DW), and black and gray bars correspond to transgenic plants AVP1-1 and AVP1-2, respectively. Values are means ± SD (n = 10). (C) Inorganic pyrophosphate-dependent 45Ca2+ uptake in vacuolar membrane vesicles. Six wild-type (black circles) and six transgenic plants from line AVP1-2 (black squares) were grown hydroponically for 9 weeks in a 16-h light/8-h dark cycle at 21°C. Root tissue vacuolar membrane vesicles were isolated and assayed as described in Materials and Methods. Then, 200-μl aliquots were filtered at the indicated times and washed with cold buffer as described (17); 5 μg/ml A23187 was added to dissipate the Ca2+ gradient as indicated by the arrow.
Figure 3
Figure 3
Wild-type and AVP1 transgenic plants deprived of water. Eight wild-type plants and eight of each of the two AVP1-overexpressing transgenic lines (AVP1-1 and AVP1-2) were grown on soil in a 16-h light/8-h dark cycle at 21°C. Plants were watered with a diluted nutrient solution (1/8 MS Murashige & Skoog salt mixture) every 4 days for 4 weeks. At week 5, the plants were watered and then transferred to a 24°C growth chamber with no further addition of water. The photograph corresponds to plants at day 10 of water-deficit stress (A) and the same plants 24 h after rewatering (B). WT, wild type.
Figure 4
Figure 4
Solute potential and water retention in wild-type and transgenic plants. (A) Solute potential of fully hydrated leaves from fully watered wild-type (WT) and two AVP1-overexpressing lines (AVP1-1 and AVP1-2). Values are means ± SD (n = 16). White bars depict wild-type solute potential values, and black and gray bars represent lines AVP1-1 and AVP1-2, respectively. (B) Relative water content of wild-type and AVP1 transgenic plants under a water-deficit stress. Eight wild-type plants and eight of each AVP1 transgenic line were grown and stressed as described (Fig. 3). The RWC of wild-type (open circles) and transgenic plants AVP1-1 (open squares) and AVP1-2 (solid triangles) was determined every 2 days. One fully expanded leaf per plant (four plants of each group every 2 days) was removed from the rosette for analysis. Values are means ± SD (n = 4 for each). (Inset) Soil gravimetric water content (SGWC) was determined at the beginning and end of the experiment. Initial values were of 3.88 (SD = 0.05), 4.03 (SD = 0.12), and 4 (SD = 0.1) for wild-type and the transgenic lines AVP1-1 and AVP1-2, respectively. The values at day 8 were of 0.23 (SD = .15), 0.35 (SD = .16), and 0.41 (SD = .09) for wild-type and the transgenic lines AVP1-1 and AVP1-2, respectively. Values are means ± SD (n = 8). White bars depict wild-type soil values, and black and gray bars represent lines AVP1-1 and AVP1-2, respectively.
Figure 5
Figure 5
ABA- and extracellular Ca2+-induced stomatal closure. Assays were performed as described in Materials and Methods. Each point is the mean of 60 stomata measured in three separate replicates. Error bars represent ± SEM relative to n = 3 replicates comprising 20 stomata/replicate. Filled squares correspond to wild type, and open and closed circles correspond to lines AVP1-1 and AVP1-2, respectively.

References

    1. Radin W J. In: Limitations to Efficient Water Use in Crop Production. Taylor H M, Jordan W R, Sinclair T R, editors. Madison, WI: ASA-CSSA-SSSA; 1983. pp. 267–276.
    1. McNeil S D, Nuccio M L, Hanson A D. Plant Physiol. 1999;120:945–949. - PMC - PubMed
    1. Bray E A, Bailey-Serres J, Weretilnyk E. In: Biochemistry and Molecular Biology of Plants. Buchanan B B, Gruissem W, Jones R L, editors. Rockville, MD: American Society of Plant Physiologists; 2000. pp. 1159–1175.
    1. Sze H, Li X, Palmgren M G. Plant Cell. 1999;11:677–689. - PMC - PubMed
    1. Zhen R G, Kim E J, Rea P A. The Plant Vacuole. Vol. 25. San Diego: Academic; 1997. pp. 298–337.

Publication types