. 2001 Sep 25;98(20):11697-701.
doi: 10.1073/pnas.171473898.

Conductivity tensor mapping of the human brain using diffusion tensor MRI

Affiliations

Conductivity tensor mapping of the human brain using diffusion tensor MRI

D S Tuch et al. Proc Natl Acad Sci U S A. .

Abstract

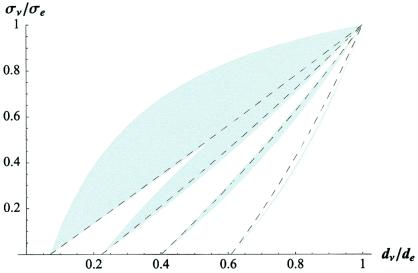
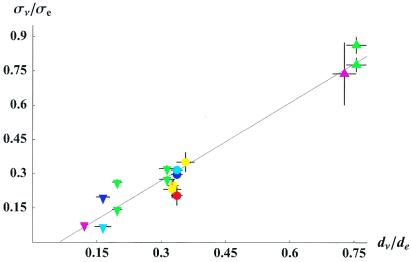
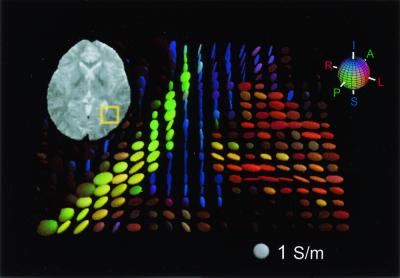
Knowledge of the electrical conductivity properties of excitable tissues is essential for relating the electromagnetic fields generated by the tissue to the underlying electrophysiological currents. Efforts to characterize these endogenous currents from measurements of the associated electromagnetic fields would significantly benefit from the ability to measure the electrical conductivity properties of the tissue noninvasively. Here, using an effective medium approach, we show how the electrical conductivity tensor of tissue can be quantitatively inferred from the water self-diffusion tensor as measured by diffusion tensor magnetic resonance imaging. The effective medium model indicates a strong linear relationship between the conductivity and diffusion tensor eigenvalues (respectively, final sigma and d) in agreement with theoretical bounds and experimental measurements presented here (final sigma/d approximately 0.844 +/- 0.0545 S small middle dots/mm(3), r(2) = 0.945). The extension to other biological transport phenomena is also discussed.


Figures

Figure 1
Figure 1
Theoretical cross-property relationship between the conductivity and diffusion tensor eigenvalues normalized by the corresponding extracellular transport coefficient. The family of dotted curves gives the cross-property relationship for values of, from left to right, di/de = {0.1, 0.3, 0.5, 0.7}. The shaded regions indicate the greatest and least upper bounds predicted by the Hashin-Shtrikman (HS) bounds (25).
Figure 2
Figure 2
Experimental relationship between the conductivity and diffusion tensor eigenvalues (mean ± SEM). The conductivity values were obtained from reported invasive measurements and the diffusion values from diffusion tensor MRI in the corresponding anatomical regions. The solid line depicts the linear fit, and the dashed lines the upper and lower confidence intervals on the linear fit. The conductivity values were taken from the average over cortex (dark blue circle, ref. ; red circle, ref. 31), the average subcortical white matter perpendicular to the tract (blue inverted triangle, ref. 28), somatosensory cortex in three perpendicular directions (yellow circle, ref. 30), the parasagital sulcus (light blue circle, ref. 29), the subcortical white matter beneath the parasagital sulcus measured perpendicular to the tract (light blue inverted triangle, ref. 29), the cerebellum parallel (green triangle) and perpendicular (green inverted triangle) to the dominant fiber orientation (32), and the anterior internal capsule parallel (purple triangle) and perpendicular (purple inverted triangle) to the tract (ref. 15).
Figure 3
Figure 3
Axial electrical conductivity tensor map of the human brain derived from the linear cross-property relation. The region of interest is highlighted in the T2-weighted image shown at top left. The conductivity tensor within each voxel is represented by a three-dimensional ellipsoid. The axes of the ellipsoid are oriented in the direction of the conductivity tensor eigenvectors and are scaled by the corresponding eigenvalues. The length of the axis relative to the isotropic tensor (1 S/m; bottom right) gives the quantitative conductivity value. The color of the ellipsoid reflects the orientation of the principal eigenvector according to the red–green–blue sphere (top right) with red indicating mediolateral, green anteroposterior, and blue superoinferior. The brightness of the tensor is scaled by the degree of anisotropy. Note the strong anisotropy in the optical radiation (green), the tapetum (blue), and the U-fiber between the middle occipital and temporal gyri (red).

References

    1. Plonsey R. Bioelectric Phenomena. New York: McGraw–Hill; 1969.
    1. Haueisen J, Ramon C, Eiselt M, Brauer H, Nowak H. IEEE Trans Biomed Eng. 1997;44:727–735. - PubMed
    1. Haueisen J, Bottner A, Nowak H, Brauer H, Weiller C. Biomed Tech (Berlin) 1999;44:150–157. - PubMed
    1. Peters M J, De Munck J C. Acta Otolaryngol Suppl (Stockholm) 1991;491:61–68. - PubMed
    1. Zhou H, van Oosterom A. IEEE Trans Biomed Eng. 1992;39:154–158. - PubMed

Publication types